The Great Lakes states are primed for an economic renaissance. The Great Lakes Region includes eight states (Minnesota, Wisconsin, Illinois, Indiana, Michigan, New York, Ohio, and Pennsylvania) and two Canadian provinces (Ontario and Quebec) that surround the five interconnected freshwater bodies known as the Great Lakes. The area is home to 107 million people, 51 million jobs, and a GDP of US$6 trillion – making the Great Lakes Economy a powerhouse on an international level.[i]
Measuring the economic opportunity of the Great Lakes States is best done from the perspective of a company considering the region for a corporate site location project. Corporate site location projects involve the process where companies decide where to grow or retain jobs and make capital investments. This process is influenced by macroeconomic, demographic, workforce, quality of life, cost of doing business, and industry cluster research as these companies want to invest in growing regions, with lower poverty rates and higher population growth, a competitive cost of doing business and a high quality of life attractive to a skilled workforce connected to common industries with this company. The Great Lakes States of Indiana, Illinois, Michigan, Ohio, Pennsylvania, and Wisconsin compete not just globally for high-wage jobs and capital investment but often with the Southern U.S. states to serve as the manufacturing heartland of the nation. Six economic conclusions about the growth prospects of the Great Lakes states compared to the South are crystal clear.
- The Great Lakes states are not growing as quickly as Southern states related to population and macroeconomic measures as the long-term Southern and Southwest U.S. state expansion continues in 2023, and this slower population and economic growth serve as a threat to future economic expansion in the Great Lakes Region.
- The Great Lakes States have a large pool of manufacturing companies and workers, but their manufacturing labor wage rates remain higher than their Southern State competitors.
- The Great Lakes States have become a less costly place to do business as state income taxes have been reduced but still ensure residents and not just companies bear the burden for the cost of local and state government operations than states that lack an income tax at all.
- The Great Lakes States have enhanced their quality of life but also have more affordable housing than faster-growing Southern markets which can have an outsized influence on corporate site location decisions as companies remain concerned about the lack of available and affordable workforce housing for their workers.
- The Great Lakes states remain an industrial powerhouse with every state in the region having an above-average base of manufacturing workers and Indiana leading the way as the number one state in the nation on a per capita basis for manufacturing.
- The Great Lakes States benefit from highly function regional and state economic development organizations and usually aggressive economic development incentives that can make up for higher labor wage rates for competitive corporate site location projects.
Indiana, Illinois, Michigan, Ohio, Pennsylvania and Wisconsin remain economic powerhouses but operate in a highly competitive market to retain and attract high-wage jobs and capital investment.
Demographics Drive Economic Opportunity in Great Lakes States
The Great Lakes Region’s demographic data offers a mixed bag for corporate site location projects.Key demographic measures that impact corporate site location decisions include total population and population growth which impact the ability of a region to provide skilled workers—the larger the population pool the more chances for creating a skilled worker. Also, homeownership and median home value illustrate whether workers will be able to afford housing. Labor issues such as the level of higher education degree attainment and how many workers are in the active workforce impact a region’s ability to attract certain types of companies and companies at all if they have no room for growth in the active labor market. Quality of life issues such as commute times to work matter as well and overall wealth measures such as median household income and poverty rate impact company location decisions.
Great Lakes Demographic Profile
| Fact | Great Lakes States | United States |
| Population | 60069787 | 333287557 |
| Population Growth 2020-22 | -0.0035 | 0.006 |
| Home Ownership Rate | 68% | 64% |
| Median Home Value | $183,467 | $244,900 |
| Bachelor’s Degree Rate | 31% | 33% |
| Civilian Labor Participation Rate | 63.75% | 63.10% |
| Commute Time | 24.98 | 26.8 |
| Median Household Income | $65,719 | $69,021 |
| Poverty Rate | 12.20% | 11.60% |
Source: US Census Bureau
As the table above illustrates, the Great Lakes states of Indiana, Illinois, Michigan, Ohio, Pennsylvania, and Wisconsin are home to over 60 M residents, but the region is not growing from a population standpoint which is troubling. Homeownership rates in the Great Lakes are higher than the national average. The median home value is lower than the national average, which is an advantage, but the bachelor’s degree attainment rate is lower than the national average. Commuting times are below the national average, but the median household income is below the national average. Finally, the poverty rate in the Great Lakes Region is slightly higher than the national average.
The demographic measures of major cities in the Great Lakes states have a big impact on corporate site location decisions. The over 500,000 in Milwaukee create a strong economic base for Wisconsin’s economic future. Affordable home prices are a positive point for Milwaukee, but the city is struggling to grow and has a below-average college-educated population rate which negatively impacts the region’s ability to attract advanced services and tech companies. Milwaukee’s high poverty rate puts it higher than some other Midwestern cities but not at Detroit’s level. Pennsylvania is the nation’s 5th largest state in the union with 12.7 M people, but its strategic location is connected to the Great Lakes in the west and the 50 million East Coast I-95 corridor positions Pennsylvania for corporate site location projects. The demographic measures of major cities in states like Pennsylvania have a big impact on corporate site location decisions. The 300,000 in Pittsburgh creates a strong economic base for Western Pennsylvania’s economic future. Affordable home prices and a highly educated population have helped Pittsburgh transition from a global steel manufacturing center to a tech hub with a continued strong base of manufacturing. Pittsburgh’s slightly high poverty rate puts it higher than some other Midwestern cities but not at Detroit’s level. Illinois is the nation’s 6th largest state in the union with 12.7 M people but its strategic location in the middle of the United States relates to a global airport and driven by the U.S.’s third largest city positions Illinois for corporate site location projects. The demographic measures of major cities in states like Illinois have a big impact on corporate site location decisions. The nearly 3 M residents of Chicago create a global hub for corporate headquarters and other economic development projects. Chicago’s large base of college-educated workers illustrates the city’s strength as an advanced services jobs center. Also, worthy of note is Chicago’s low poverty rate compared with other Great Lakes urban competitors.
Great Lakes Urban Center Demographic Benchmark Comparison
| Fact | Milwaukee | Indianapolis | Pittsburgh | Chicago | Detroit | Columbus |
| Population | 569,330 | 882,039 | 300,431 | 2,696,551 | 632,464 | 906,528 |
| Population Change from 2020 to 2021 | -1.4% | -0.6% | -0.9% | -0.1% | -1.1% | 0.1% |
| Homeownership Rate | 40.90% | 54.50% | 47.40% | 45.60% | 48.30% | 44.80% |
| Median Home Value | $135,600 | $156,300 | $147,600 | $277,600 | $57,700 | $174,400 |
| Bachelor’s Degree Rate | 25.50% | 32.90% | 45.70% | 41.70% | 16.20% | 37.90% |
| Civilian Labor Participation Rate | 63.90% | 66.80% | 64.00% | 67.30% | 54.30% | 70.50% |
| Mean Commute Time | 22.3 | 23.9 | 23.9 | 34.4 | 25.7 | 22 |
| Median Household Income | $45,318 | $54,321 | $54,306 | $66,576 | $34,762 | $58,575 |
| Poverty Rate | 24.10% | 16.40% | 19.70% | 17.10% | 31.80% | 18.40% |
Source: US Census Bureau
Population growth is a critical measure of economic success. Growing population centers attract companies struggling to find skilled labor. A growing population base creates a larger pool of workers for companies. As the table below illustrates, Milwaukee along with traditional urban industrial cities like Pittsburgh are not growing at the same pace as faster-developing cities such as Columbus, and Indianapolis and southern markets such as Charlotte. The population growth outlined below is tied to these major cities and not their Metropolitan Statistical Area. As an example, the four-county region encompassing Milwaukee has only experienced a population decline of 0.7% since 2017, falling by 10,889, and population is expected to decrease by 1.3% between 2022 and 2027, losing 20,118.
| Population Growth | ||||||
| Year | Columbus | Chicago | Milwaukee | Pittsburgh | Charlotte | Indianapolis |
| 2021 | 906,528 | 2,696,551 | 569,330 | 300,431 | 879,709 | 880,104 |
| 2020 | 905,860 | 2,699,347 | 576,301 | 302,777 | 876,747 | 869,387 |
| 2019 | 899,908 | 2,709,534 | 590,952 | 300,056 | 887,928 | 864,447 |
| 2018 | 891,448 | 2,718,555 | 591,961 | 300,669 | 874,187 | 857,637 |
| 2017 | 882,253 | 2,722,586 | 594,154 | 301,606 | 861,170 | 853,431 |
| 2016 | 867,384 | 2,714,017 | 597,179 | 304,789 | 843,989 | 846,674 |
| 2015 | 855,276 | 2,717,534 | 600,607 | 304,224 | 826,270 | 841,449 |
| 2014 | 841,931 | 2,712,608 | 600,775 | 306,080 | 807,875 | 835,097 |
| 2013 | 827,994 | 2,706,101 | 599,997 | 307,006 | 792,408 | 828,841 |
| 2012 | 812,872 | 2,702,471 | 598,627 | 306,455 | 773,506 | 822,006 |
| 2011 | 800,677 | 2,700,741 | 597,132 | 306,117 | 754,943 | 815,607 |
| 2010 | 790,942 | 2,703,466 | 594,883 | 305,351 | 738,446 | 809,804 |
| Percent Change | 14.61% | -0.26% | -4.30% | -1.61% | 19.13% | 8.68% |
| Number Change | 115,586 | -6,915 | -25,553 | -4,920 | 141,263 | 70,300 |
Source: US Census Bureau
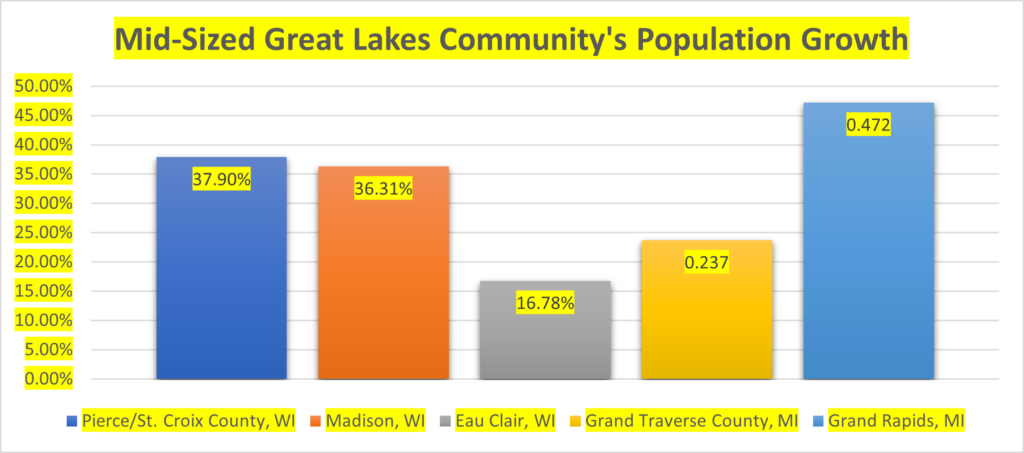
Not all the economic growth is happening in the major urban markets in the Great Lakes states. Mid-sized urban markets in these states have seen substantial population growth—in some cases larger than their big city neighbor. Regions from suburban Minneapolis in Wisconsin to Eau Clair and Madison Wisconsin and Traverse City and Grand Rapids Michigan have all illustrated steady growth while their big city counterparts have lost population. All of these communities have seen double-digit population growth—some over 40% illustrating the strength of not just these regions but of the state to retain and grow a population base critical to economic success.
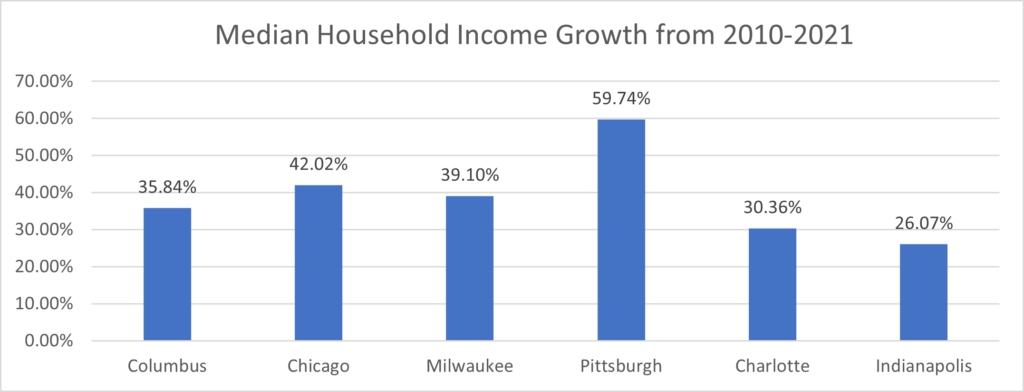
Median household income refers to the income level earned by a given household where half of the households in the geographic area of interest earn more and half earn less as measured by the U.S. Census Bureau. Median household income is an important demographic measure as it tells companies the relative wealth of a geographic region. The chart below compares the median household income of Milwaukee to competitor metro regions. Pittsburgh is the leader in the Great Lakes states but also has median household growth higher than the southern regional leader of Charlotte.
Source: U.S. Census Bureau
[i] https://councilgreatlakesregion.org/the-great-lakes-economy-the-growth-engine-of-north-america/#:~:text=The%20Great%20Lakes%20Region%20includes,powerhouse%20on%20an%20international%20level.