Pennsylvania is the nation’s 23rd largest state in the union with 5.8 M people, but its strategic location is connected to the Great Lakes positions Wisconsin for corporate site location projects.
Key demographic measures that impact corporate site location decisions include total population and population growth which impact the ability of a region to provide skilled workers—the larger the population pool the more chances for creating a skilled worker. Also, homeownership and median home value illustrate whether workers will be able to afford housing. Labor issues such as the level of higher education degree attainment and how many workers are in the active workforce impact a region’s ability to attract certain types of companies and companies at all if they have no room for growth in the active labor market. Quality of life issues such as commute times to work matter as well and overall wealth measures such as median household income and poverty rate impact company location decisions.
The demographic measures of major cities in states like Wisconsin have a big impact on corporate site location decisions. The over 500,000 in Milwaukee create a strong economic base for Wisconsin’s economic future. Affordable home prices are a positive point for Milwaukee, but the city is struggling to grow and has a below-average college-educated population rate which negatively impacts the region’s ability to attract advanced services and tech companies. Milwaukee’s high poverty rate puts it higher than some other Midwestern cities but not at Detroit’s level.
Midwest Urban Center Demographic Benchmark Comparison
| Fact | Milwaukee | Indianapolis | Pittsburgh | Chicago | Detroit | Columbus |
| Population | 569,330 | 882,039 | 300,431 | 2,696,551 | 632,464 | 906,528 |
| Population Change from 2020 to 2021 | -1.4% | -0.6% | -0.9% | -0.1% | -1.1% | 0.1% |
| Homeownership Rate | 40.90% | 54.50% | 47.40% | 45.60% | 48.30% | 44.80% |
| Median Home Value | $135,600 | $156,300 | $147,600 | $277,600 | $57,700 | $174,400 |
| Bachelor’s Degree Rate | 25.50% | 32.90% | 45.70% | 41.70% | 16.20% | 37.90% |
| Civilian Labor Participation Rate | 63.90% | 66.80% | 64.00% | 67.30% | 54.30% | 70.50% |
| Mean Commute Time | 22.3 | 23.9 | 23.9 | 34.4 | 25.7 | 22 |
| Median Household Income | $45,318 | $54,321 | $54,306 | $66,576 | $34,762 | $58,575 |
| Poverty Rate | 24.10% | 16.40% | 19.70% | 17.10% | 31.80% | 18.40% |
Source: US Census Bureau
Population growth is a critical measure of economic success. Growing population centers attract companies struggling to find skilled labor. A growing population base creates a larger pool of workers for companies. As the table below illustrates, Milwaukee along with traditional urban industrial cities like Pittsburgh are not growing at the same pace as faster developing cities such as Columbus, and Indianapolis and southern markets such as Charlotte.
| Population Growth | ||||||
| Year | Columbus | Chicago | Milwaukee | Pittsburgh | Charlotte | Indianapolis |
| 2021 | 906,528 | 2,696,551 | 569,330 | 300,431 | 879,709 | 880,104 |
| 2020 | 905,860 | 2,699,347 | 576,301 | 302,777 | 876,747 | 869,387 |
| 2019 | 899,908 | 2,709,534 | 590,952 | 300,056 | 887,928 | 864,447 |
| 2018 | 891,448 | 2,718,555 | 591,961 | 300,669 | 874,187 | 857,637 |
| 2017 | 882,253 | 2,722,586 | 594,154 | 301,606 | 861,170 | 853,431 |
| 2016 | 867,384 | 2,714,017 | 597,179 | 304,789 | 843,989 | 846,674 |
| 2015 | 855,276 | 2,717,534 | 600,607 | 304,224 | 826,270 | 841,449 |
| 2014 | 841,931 | 2,712,608 | 600,775 | 306,080 | 807,875 | 835,097 |
| 2013 | 827,994 | 2,706,101 | 599,997 | 307,006 | 792,408 | 828,841 |
| 2012 | 812,872 | 2,702,471 | 598,627 | 306,455 | 773,506 | 822,006 |
| 2011 | 800,677 | 2,700,741 | 597,132 | 306,117 | 754,943 | 815,607 |
| 2010 | 790,942 | 2,703,466 | 594,883 | 305,351 | 738,446 | 809,804 |
| Percent Change | 14.61% | -0.26% | -4.30% | -1.61% | 19.13% | 8.68% |
| Number Change | 115,586 | -6,915 | -25,553 | -4,920 | 141,263 | 70,300 |
Median household income refers to the income level earned by a given household where half of the households in the geographic area of interest earn more and half earn less as measured by the U.S. Census Bureau. Median household income is an important demographic measure as it tells companies the relative wealth of a geographic region. The chart below compares the median household income of Milwaukee to competitor metro regions. Pittsburgh is the leader in the Great Lakes states but also has median household growth higher than the southern regional leader of Charlotte.
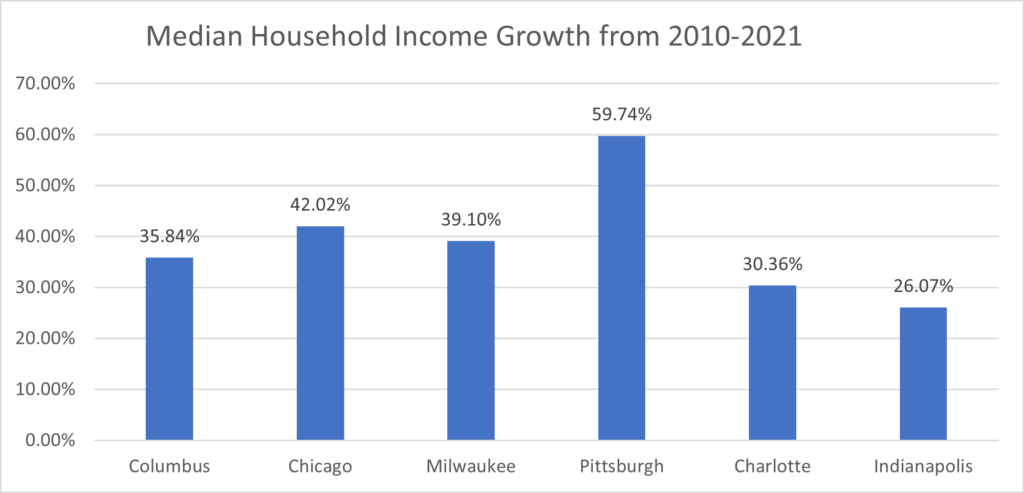
Source: U.S. Census Bureau
Comparing regional gross domestic product growth is another critical economic development measure that companies consider. A region’s gross domestic product is the sum of its total economic output for the public and private sectors. Regions with growing economies are generally more attractive to companies considering a corporate site location decision.
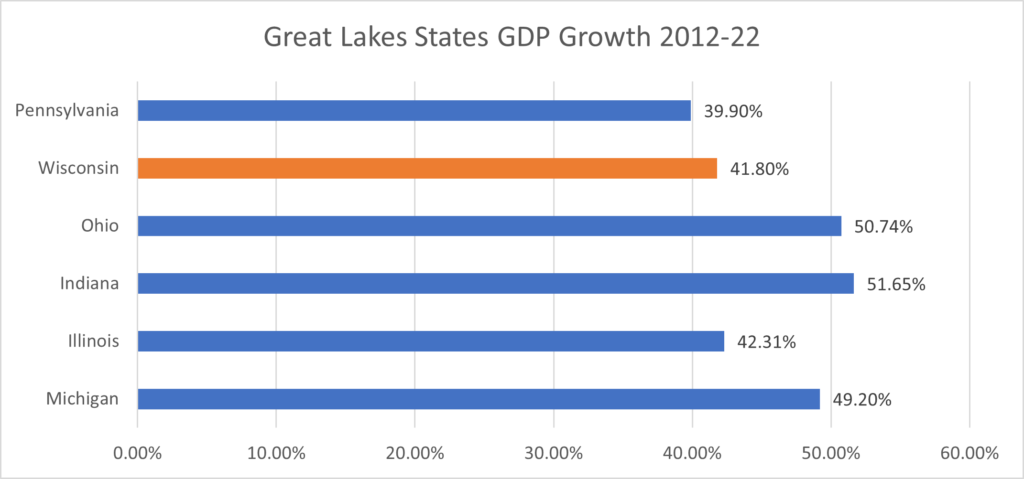
Source: St. Louis Federal Reserve FRED
As the table above illustrates, Wisconsin has enjoyed growth in its GDP from 2012 to 2022 but the state overall does not compare well to other Great Lakes states- with slower growth rates than all the other Great Lakes states.
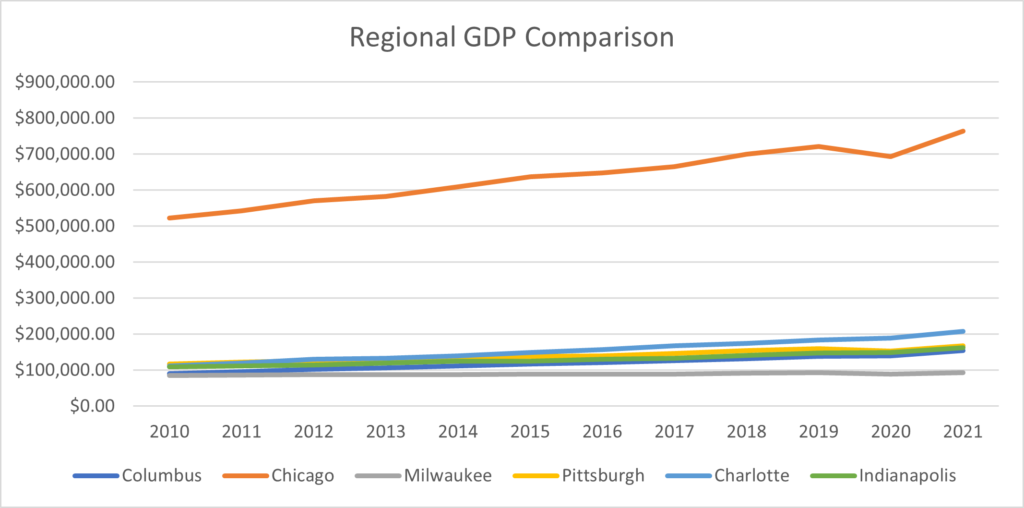
Source: St. Louis Federal Reserve, FRED
As the chart above illustrates, the Milwaukee region remains in step with most of the other Great Lakes urban centers from a total economic output standpoint than many peer cities with Charlotte growing at a faster pace than other mid-sized urban markets. Demographic and economic data for Wisconsin and Milwaukee provide a mixed bag from an economic and demographic performance standpoint. The regions constitute large and growing economic markets but, again like most of their Midwest urban markets, are growing at a slower rate than booming southern regions.