Housing is joining workforce development to become a major corporate site location issue. Regions not growing are failing to develop substantial residential growth. Finally, rural regions are losing population at an alarming rate and desperately need new residential products to retain existing employers and to keep their young people. No matter where you are in the United States, the availability of attainable housing that young and old alike can afford is needed. The simple fact is regions cannot retain and attract companies without workers—workers won’t go to regions where they cannot afford housing.
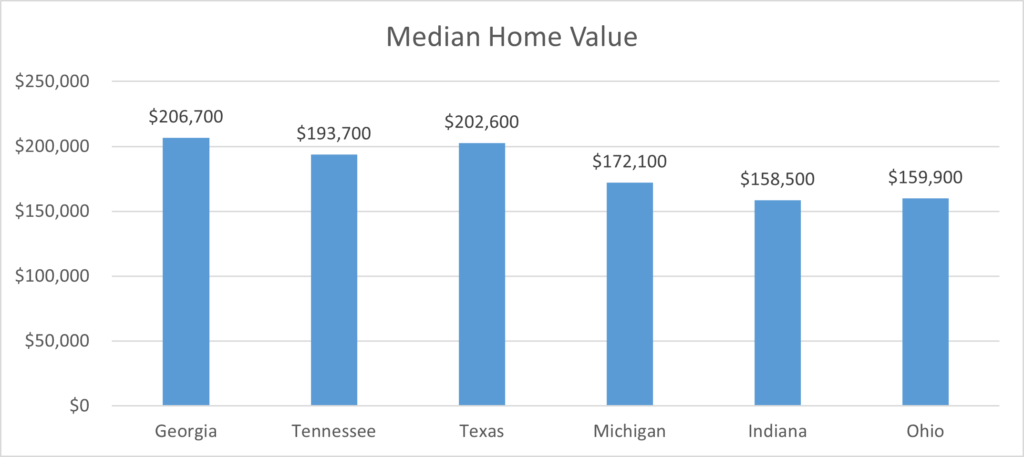
Source: US Census Bureau
As the table above illustrates, the median home value in the state of Michigan is on par with regional Midwest competitors but actually is below faster-growing southern states such as Georgia, Tennessee, and Texas. While these southern states have grown substantially from a population and economic standpoint in recent decades, data such as the median home value indicate this fast-growth market are not keeping up with housing demand and this is impacting their cost of doing business from a residential standpoint.
As the table below illustrates, over a 12-year timeframe from 2010 to 2022, the development of new housing in Michigan is slow compared to like communities in the Midwest and South. Charlotte has an average of 19,945 building permits per year, Nashville has an average of 17,397 building permits per year, Columbus has an average of 8,528 building permits per year, Detroit has an average of 540 building permits per year, Grand Rapids 409 and Cleveland has an average of 2,847 building permits per year. This data illustrates the challenges these Michigan cities face in the development of residential products.
| Regional Building Permit Comparison (City) | ||||||||||||
| Year | Detroit | Grand Rapids | Columbus | Cleveland | Nashville | Charlotte | ||||||
| 2022 (Preliminary) | 1,379 | 193 | 12,289 | 3,315 | 18,833 | 27,113 | ||||||
| 2021 | 1,023 | 286 | 12,062 | 3,340 | 32,322 | 30,062 | ||||||
| 2020 | 850 | 305 | 12,358 | 3,374 | 27,242 | 26,493 | ||||||
| 2019 | 399 | 336 | 8,090 | 3,032 | 22,812 | 24,590 | ||||||
| 2018 | 170 | 814 | 9,440 | 2,981 | 19,159 | 26,209 | ||||||
| 2017 | 1,029 | 878 | 8,892 | 3,227 | 20,631 | 22,869 | ||||||
| 2016 | 409 | 1,398 | 8,637 | 3,053 | 20,182 | 20,574 | ||||||
| 2015 | 631 | 455 | 7,555 | 2,938 | 18,291 | 19,543 | ||||||
| 2014 | 238 | 203 | 7,052 | 2,926 | 15,040 | 18,537 | ||||||
| 2013 | 113 | 155 | 8,401 | 2,780 | 11,610 | 16,844 | ||||||
| 2012 | 146 | 219 | 6,846 | 2,332 | 8,789 | 13,228 | ||||||
| 2011 | 245 | 59 | 4,757 | 1,767 | 5,819 | 7,122 | ||||||
| 2010 | 383 | 18 | 4,479 | 1,941 | 5,433 | 6,102 | ||||||
| Total | 7,015 | 5,319 | 110,858 | 37,006 | 226,163 | 259,286 | ||||||
| Yearly Average | 540 | 409 | 8,528 | 2,847 | 17,397 | 19,945 | ||||||
The median residential listing price is another important measure of the strength of the regional housing market. This is an indicator of the current and future strength of the housing market. Also, from a corporate site location standpoint, lower median residential listing prices illustrate markets where a company’s employees can actually afford to buy a home. Many fast-growing markets are simply not keeping up with the housing demand which is dramatically increasing the price of housing.
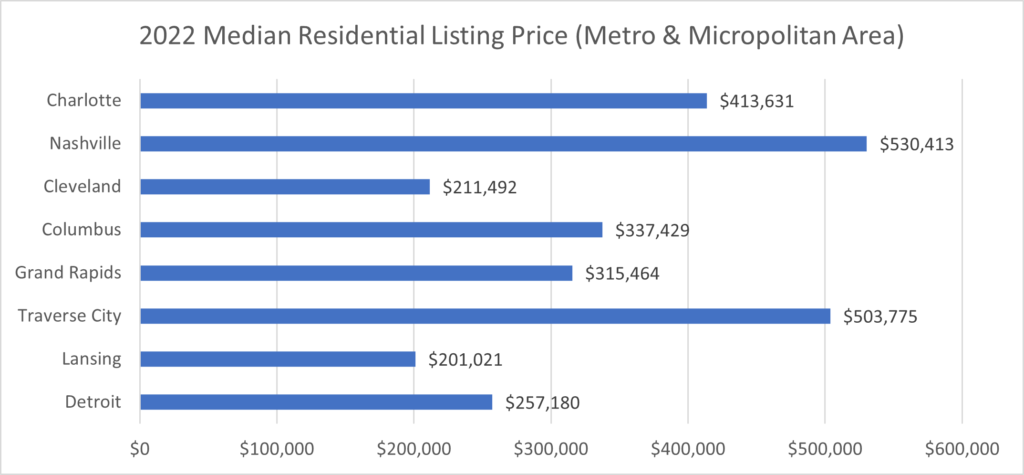
Source: St. Louis Federal Reserve
Michigan’s cost of housing is a major strategic advantage from a corporate site location standpoint. While Traverse City who is managing a boom in their market based upon being a national vacation and retirement community, Detroit, Grand Rapids, and Lansing remain very affordable markets for home ownership based upon the data in the graph above compared to their national and regional competitors. From a rental standpoint, these same Michigan cities are for the most part on par with national and regional competitors as illustrated by the graph below.
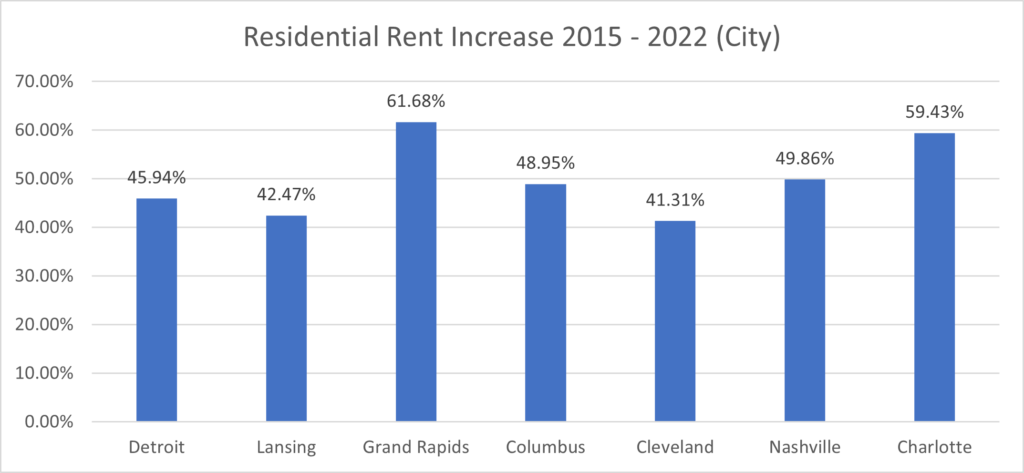
Growing housing that workers can afford is a critical corporate site location issue and Michigan’s major urban centers offer comparatively affordable housing that is experiencing price increases with a dwindling supply. Housing is a growing corporate site location issue for all regions of the nation and Ohio falls in line with this national trend.