While the United States remains a global economic powerhouse, not all regions of the United States are created equally from an economic development standpoint, and the South and Southwest will remain regional macroeconomic growth leaders this year based upon the analysis of the Montrose Group for what trends are apparent for corporate site location in 2020. Real Gross Domestic Product (GDP) increased in all 50 states and the District of Columbia in the second quarter of 2019, according to the U.S. Bureau of Economic Analysis. The % change in real GDP in the second quarter ranged from 4.7 % in Texas to 0.5 % in Hawaii.
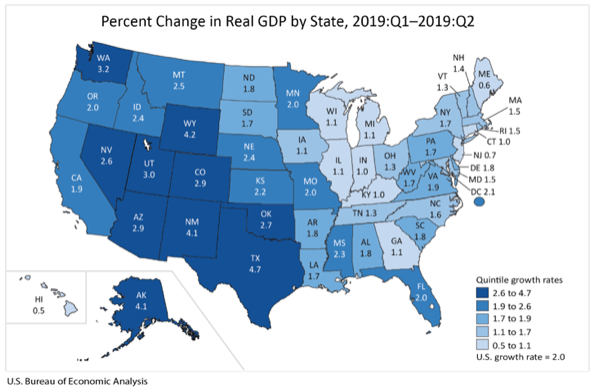
Professional, scientific, and technical services; government; real estate and rental and leasing; and mining were the leading contributors to the increase in real GDP nationally, and mining increased 23.5 % for the nation and was the leading contributor to the increases in Texas, Wyoming, Alaska, and New Mexico—the fastest growing states. Professional, scientific, and technical services increased 7.4 % for the nation and contributed to growth in all 50 states and the District of Columbia. Government increased 3.1 % for the nation and contributed to growth in all 50 states and the District of Columbia. Real estate and rental and leasing increased 2.6 % for the nation and contributed to growth in 49 states and the District of Columbia. Wholesale trade decreased 6.7 % for the nation, subtracting from growth in all 50 states and the District of Columbia. Wholesale trade was the leading contributor to slow growth in Hawaii, Maine, and New Jersey – the slowest growing states.
The Southern and Southwest regions of the United States illustrate long-term economic growth trends far stronger than the population rich East Coast and industrial Midwest regions.
Private Sector Job Growth Benchmark Comparison
| Select Mid-Sized MSAs | Non-Farm Payroll Growth 2017-18 | Mega Cities | Non-Farm Payroll Growth 2017-18 |
| St. Louis, MO | 1.4% | New York, NY | 1.1% |
| Kansas City, MO | 1.7% | Los Angeles, CA | 1.9% |
| Charlotte, NC | 2.4% | Chicago, IL | .9% |
| Jacksonville, FL | 2.1% | Dallas-Fort Worth, TX | 3.0% |
| Des Moines, IA | 3.4% | Houston, TX | 3.9% |
| Tampa, FL | 2.2% | Washington, DC | 1.8% |
| Raleigh, NC | 3.3% | Miami, FL | 2.4% |
| Indianapolis, IN | 2.3% | Atlanta, GA | 2.2% |
| Columbus, OH | 1.9% | Boston, MA | 1.9% |
Source: Bureau of Economic Analysis
As the table above illustrates, both mid-sized cities and mega-cities (ten largest cities in the United States) illustrate strong private sector job growth in recent years. The trend of Southern and Southwestern regional growth is strengthened by the table below that outlines regional GDP growth. This trend is further confirmed when these same regions are compared from a growth in GDP standpoint. The Southern cities of Nashville, Charlotte, Jacksonville, Dallas, Austin, Raleigh-Durham and Atlanta continue to illustrate substantial economic growth compared to the anemic, high-cost East Coast and many struggling Midwestern Industrial regions. To further illustrate the growth prospects for the Western and Southern states are projections for future job creation in 2020 as outlined in the chart below.
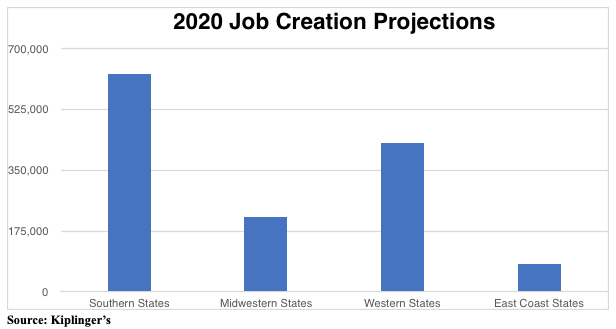
In 2020, economic growth prospects for the Southern states will be driven by continued manufacturing strength and the West Coast success in the tech sector will continue economic success for these regions compared to their Midwestern and East Coast competitors.