

The most expensive assumption in corporate site location is that the workers will be there. Incentive packages, tax abatements, and shovel-ready sites all presume a labor pool that can staff the operation at an affordable wage. When that pool proves too thin, too expensive, or too far away, the project underdelivers or never ramps. For companies and communities alike, a workforce development plan — increasingly one that treats childcare as core infrastructure — has become the analysis that separates a defensible location decision from a costly guess.
The logic is straightforward. A corporate site is only as good as its labor shed: the commuting zone from which it can realistically draw talent. Before committing capital, a company needs to know whether target occupations exist in sufficient numbers, what those workers earn, and how many competing employers are bidding for them. A community that wants the project needs the same answers, plus a credible plan to close any gap the data reveals.
Childcare Has Moved to the Center of the Analysis
Labor force participation, especially among working parents, is now constrained less by skills than by the absence of affordable, reliable childcare. A region can have the right head count on paper and still fail to staff a second shift because parents cannot find care. Employers increasingly discover their true constraint is not training capacity but childcare capacity. That is why leading workforce plans now model childcare supply and cost alongside occupational data.
Completing this plan early does three things. It de-risks the location decision with evidence instead of optimism. It gives the community a concrete, fundable action agenda. Finally, it builds the shared narrative a company and community need to move at deal speed.
Data Sources: Does the Workforce Pool Exist Near the Site?
A credible answer draws on layered data, triangulated rather than taken from any single source:
- U.S. Bureau of Labor Statistics — OEWS for occupation-level wages, QCEW for industry employment, LAUS for unemployment, and the Current Population Survey for participation
- U.S. Census Bureau / ACS — population, age structure, educational attainment, and commuting patterns
- Census LEHD and OnTheMap — origin-and-destination data that maps the true labor shed
- State Labor Market Information offices — the most granular state-verified wage data and projections
Talent pipeline and wage benchmarking round out the picture: IPEDS and CTE completion data, apprenticeship records (RAPIDS),and wage benchmarking against OEWS, ERI, and employer surveys.
Childcare Supply and Cost: The Binding Constraint
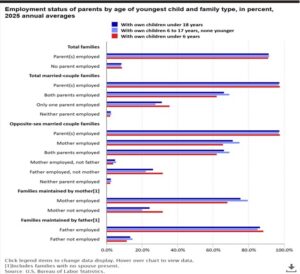
According to the BLS, 32.9 million families — two-fifths of all families — included children under 18 in 2025. At least one parent worked in 91.6 percent of them. Half of all two-parent households have both parents working, and 60% of African American two-parent households do. Meanwhile, an estimated 4.2 million American children face a childcare gap. Tools to size the local gap include state licensing databases, Child Care Aware market-rate surveys, childcare desert analyses, and GIS drive-time mapping.
Listening Steps: Building a Local Workforce Program
Data reveals the gap; listening reveals how to close it:
- Convene the right table — employers, the workforce board, colleges, K-12, childcare providers, and elected officials.
- Interview and survey employers on openings, turnover, wages, and the barriers keeping roles unfilled.
- Listen to workers and job-seekers about transportation, childcare, scheduling, and credential access.
- Assess training-provider capacity and employer alignment.
- Conduct dedicated childcare listening with parents, providers, and employer HR data.
- Map the barriers and validate priorities with stakeholders.
- Design governance and metrics — credentials, placements, retention, wage gains, and new childcare slots.
Action Steps: Training and Childcare
On the training side: employer-led sector partnerships, customized and incumbent-worker training, registered apprenticeships, aligned CTE pathways, rapid stackable credentials, and work-based learning with wraparound supports.
On the childcare side: employer-supported care and tri-share cost models, provider expansion grants, nontraditional-hours care for second and third shifts, shared services models, investment in the care workforce itself, and zoning reforms that let new capacity open faster.
Funding for Workforce and Childcare Planning
Federal sources include WIOA, U.S. EDA programs, Department of Labor competitive grants, ARC and USDA Rural Development, CCDF/CCDBG, and CDBG. State examples include Ohio’s TechCred and JobsOhio Workforce Grant, Indiana’s Employer Training Grant and Employer-Sponsored Child Care Grants (up to $750,000), and Kentucky’s Bluegrass State Skills Corporation and ECCAP. Community foundations remain the fastest, lowest-match source for the plan itself, alongside national funders like the Annie E. Casey Foundation, W.K. Kellogg Foundation, and Ballmer Group.
Case Study: Where the Aerospace and Defense Workforce Lives
The Montrose Group, in partnership with Malone Workforce Solutions, analyzed the top U.S. regions for aerospace and defense location based primarily on workforce. The largest clusters anchor in Seattle, Norfolk, Washington D.C., San Diego, and Huntsville. Together, these five regions employ more than 400,000 A&D workers — 40% of the national total.
| Rank | Metro | P Score (0–25) | Key Employers |
|---|---|---|---|
| 1 | Seattle, WA | 25 | Boeing, Blue Origin, Aerojet Rocketdyne |
| 2 | Norfolk–Virginia Beach, VA | 24 | Huntington Ingalls, U.S. Navy, General Dynamics |
| 3 | Washington D.C.–NoVA–MD | 23 | Lockheed Martin, Northrop Grumman, DoD HQ |
| 4 | San Diego, CA | 22 | General Atomics, Northrop Grumman, NASSCO |
| 5 | Huntsville, AL | 21 | NASA Marshall, Redstone Arsenal, Boeing |
Workforce has been a central issue since the Baby Boomers began retiring. Moreover, the declining number of 18-year-olds nationwide keeps workforce and childcare at the top of the list for companies and communities alike.
The Montrose Group has completed over sixty economic development plans for public and private sector clients. Contact Dave Robinson at drobinson@montrosegroupllc.com if you need assistance with any economic development plan.