

At the upcoming Montrose Group 2025 Economic Development and Public Policy Forum, leaders with an expertise on a range of issues will outline critical economic development strategies that can transform companies and communities into 21st Century success stories. The basis of this discussion will be a benchmarking exercise between three successful state economic markets- Indiana, Kentucky and Ohio. These markets can reach roughly 1/3 of the United States within a 10 hour truck drive- a key metric for the manufacturing and logistics industries. Another major issue to be addressed at our forum relates to global trade and its impact on corporate site location. The Trump Administration’s weaponization of tariffs could either or both send the U.S. economy into a recession or drive global manufacturing back to the United States. Either path requires companies and communities to understand how best to capture global investment. We hope you can participate in the Montrose Group 2025 Economic Development Forum and enjoy our most recent newsletter. If you have any questions, do not hesitate to contact me at drobinson@montrosegroupllc.com.
Sincerely,
David J. Robinson
Principal
Montrose Group, LLC
Montrose Group’s Harrison Crume is an IMPLAN Certified Economist
 Harrison Crume, Manager of Economic Development for Montrose Group, is now an IMPLAN Certified Economist. Harrison worked for the Montrose Group for three years following his graduation from the University of Cincinnati with an Economics degree.
IMPLAN is a widely used software platform and data source for economic impact analysis. It’s based on input-output modeling, which helps quantify the overall economic effects of an event or change within a specific region. IMPLAN analyzes direct, indirect, and induced impacts, using detailed data to model the flow of money between industries and households. The goal of the IMPLAN Certified Economist Program is to train individual customers in Input-Output theory and analysis specifically tailored to the IMPLAN Cloud application. The purpose of the program is to elevate the quality and credibility of studies done using the IMPLAN Cloud system by certifying specific people who demonstrate a wide and deep understanding of I-O analysis in general and the IMPLAN Cloud system in particular, who strive to be unbiased in their modeling and reporting, and who have shown a willingness to properly document the methods and data used in their IMPLAN analyses.
Harrison Crume leads the Montrose Group’s economic development planning efforts as the researcher for a wide range of economic development plans, corporate site location market research and Economic Impact Statements (EIS) developed for a wide range of corporate site location and public policy projects. Harrison’s economic development planning experience includes the creation not just of EIS but of comprehensive economic development plans, industry cluster analysis, macroeconomic and demographic analysis, workforce development and housing studies, site development analysis, placemaking and Downtown redevelopment strategies, and other plans and studies. These studies are used to shape the creation of public-private partnerships through the creation of a Return on Investment analysis, deciding the price point a local community housing market should be focused on, impacting the award of large government tax credits for Transformational Mixed Used Developments or Low Income Housing Tax Credits and dozens of other end uses.
Adding in the IMPLAN Certified Economist designation for Harrison merely confirms his depth of knowledge related to completing economic development research and analysis. All good corporate site location, public policy and economic development strategy starts with a deep data dive to ensure company, community and public policy maker decisions are aligned with their end goals.
The Montrose Group is proud but not surprised that Harrison Crume has reached the status of an IMPLAN Certified Economist.
Montrose Group Monthly Economic Metrics
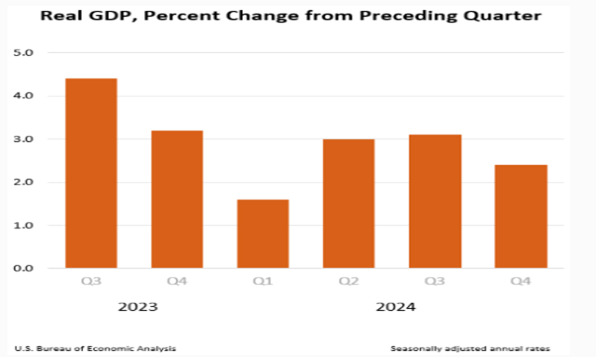
Q4 2024 Gross Domestic Product. Real gross domestic product (GDP) increased at an annual rate of 2.4 percent in the fourth quarter of 2024 (October, November, and December), according to the third estimate released by the U.S. Bureau of Economic Analysis. In the third quarter, real GDP increased 3.1 percent. The increase in real GDP in the fourth quarter primarily reflected increases in consumer spending and government spending that were partly offset by a decrease in investment. Imports, which are a subtraction in the calculation of GDP, decreased.
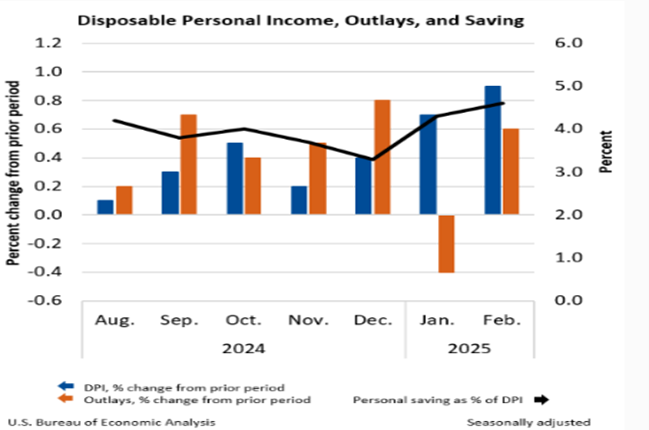
Personal Income and Outlays. Personal income increased $194.7 billion (0.8 percent at a monthly rate) in February, according to estimates released today by the U.S. Bureau of Economic Analysis. Disposable personal income (DPI)—personal income less personal current taxes—increased $191.6 billion (0.9 percent) and personal consumption expenditures (PCE) increased $87.8 billion (0.4 percent). Personal outlays—the sum of PCE, personal interest payments, and personal current transfer payments—increased $118.4 billion in February. Personal saving was $1.02 trillion in February and the personal saving rate—personal saving as a percentage of disposable personal income—was 4.6 percent.
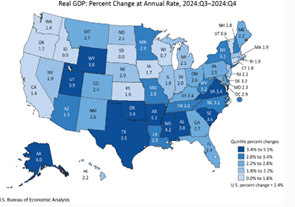
GDP Growth by State. Real gross domestic product increased in 48 states and the District of Columbia in the fourth quarter of 2024, with the percent change ranging from 5.1 percent at an annual rate in Arkansas to 0.6 percent in Vermont and remaining unchanged in Idaho and South Dakota. Personal income, in current dollars, increased in all 50 states and the District of Columbia in the fourth quarter of 2024, with the percent change ranging from 6.1 percent at an annual rate in Delaware to 2.4 percent in Louisiana. Ohio grew by 2.6%, Indiana grew by 2.0% and Kentucky grew by 2.4%.
Economic Development Competitive Analysis: Indiana v. Kentucky v. Ohio
While Indiana, Kentucky and Ohio are strong industrial markets, a competitive analysis of these states illustrates strengths of weaknesses of these states. A competitive analysis of these three states needs to focus on the market research and site analysis just a company would be considering these states for economic investment and should provide insight into how local, and state policymakers can improve their economic environment through workforce, housing, energy, tax, regulatory and economic development incentive policy all of which impact a company’s decision to create high-wage jobs and capital investment.
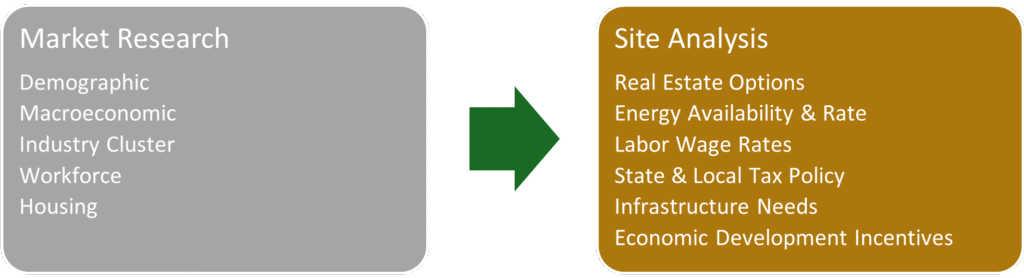
Indiana, Kentucky and Ohio are all strong economic markets with a skilled labor pool, urban and rural markets with an industrial industry base and metro regions often connected to each other that creates interstate corporate site location competition.
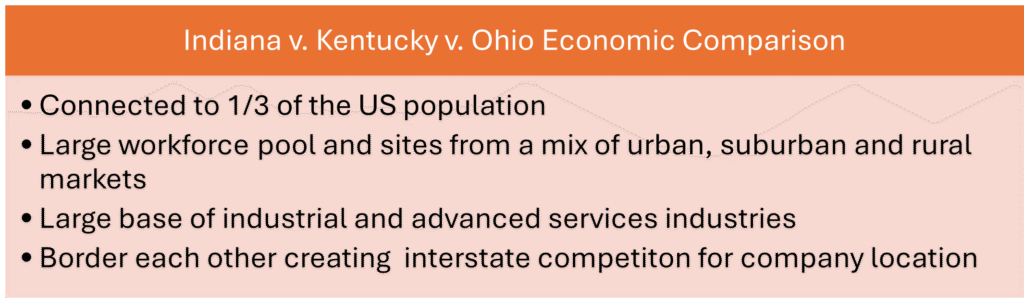
Kentucky, Indiana and Ohio have large population bases with Ohio being about the same population size as Indiana and Kentucky put together, but Ohio is growing much slower than their regional rivals. The states are affordable to buy a home, have common income levels and poverty rates. Ohio is a much larger economy with three major metro regions and several small metro areas, and Ohio and Indiana’s economies have grown faster than Kentucky in the last decade. All have strong manufacturing sectors with Indiana leading the nation on a per capita basis and their wage rates for this industry are like Indiana’s wage rate being slightly higher.
Indiana, Kentucky & Ohio Demographic, Economic, Workforce, Housing, Regulatory and Energy Comparison
| Metric | Kentucky | Ohio | Indiana |
| Population | 4,526,154 | 11,785,935 | 6,862,199 |
| Population Growth | 4.3% | 2.2% | 5.8% |
| Rural Population Growth | -.72 | -2.4% | -.16 |
| Median home value | $155,500 | $159,900 | $158,500 |
| Median household income | $55,454 | $61,938 | $61,944 |
| Poverty Rate | 16.5% | 13.4% | 12.2% |
| Homeownership Rate | 68.10% | 66.80% | 70.10% |
| Civilian Labor Participation Rate | 59.20% | 63.10% | 63.80% |
| State GDP (in millions $) | $201,380 | $852,902 | $352,096 |
| GDP Growth 2012-22 | 37.81% | 51.65% | 50.74% |
| Average Manufacturing Wage | $68,223 | $72,566 | $74,338 |
| Manufacturing Location Quotient | 1.55 | 1.49 | 2.01 |
| Bachelor’s degree or higher | 25.7% | 29.7% | 27.8% |
| Employment-to-Population Ratio | 54.7% | 60.8% | 61.6% |
| Unemployment Rate | 5.0% | 4.4% | 4.3% |
| Business Taxes Per Employee | $6.20 | $5.60 | $5.70 |
| State Effective Property Tax Rate | .83 | 1.56 | .85 |
| Homeownership rate | 67.8% | 66.6% | 69.9% |
| Township Zoning | No | Yes | No |
| Zoning Referendum | No | Yes | No |
| Energy | Regulated | Regulated | Deregulated |
Source: Census Bureau Quick Facts, Bureau of Labor Statistics
Indiana, Kentucky and Ohio are home to growing metro regions that drive economic growth, and the table below compares them for demographic, economic, industry cluster, workforce, and housing factors.
Indiana, Kentucky and Ohio Metro Regional Comparison
| Fact | Louisville | Indianapolis | Lexington | Cincinnati | Cleveland | Columbus |
| Population 2023 | 1,365,557 | 2,111,040 | 520,045 | 2,271,479 | 2,063,132 | 2,180,271 |
| Population Growth | 0.2% | 2.2% | 0.5% | 0.9% | -1.1% | 1.8% |
| Homeownership Rate | 69.2% | 55% | 59.6% | 69.1% | 66.6% | 61.2% |
| Median Home Value | $245,700 | $278,200 | $270,300 | $248,700 | $209,000 | $282,200 |
| Bachelor’s Degree or Higher Rate | 35.3% | 39.7% | 42.1% | 36.9% | 36.1% | 40.0% |
| Civilian Labor Participation Rate | 65.9% | 63.2% | 66.6% | 65.8% | 63.2% | 67.5% |
| GDP (millions) | $97,751.023 | $199,197.977 | $38,612.656 | $198,888.723 | $139,934.845 | $182,087.631 |
| Mean Commute Time (minutes) | 23.8 | 25.4 | 21.7 | 25.2 | 24.2 | 23.5 |
| Household Income | $69,547 | $77,947 | $65,964 | $75,062 | $65,198 | $75,777 |
| Poverty Rate | 12.1% | 10.6% | 14.0% | 11.8% | 13.7% | 12.4% |
| Housing Price to Income Ratio | $4.53 | $4.32 | $5.69 | $4.65 | $3.43 | $4.74 |
| Industrial Vacancy Rate | 4.1% | 11.1% | 9.15% | 5.9% | 2.6% | 7.6% |
| Industrial Asking Rent | $6.02 | $5.96 | $11.95 | $6.29 | $5.85 | $6.66 |
| Office Vacancy | 16.2% | 22.9% | 11.21% | 26.0% | 11.0% | 24.7% |
| Office Class A Asking Rent | 18.68% | $21.90 | $19.19 | $20.73 | $19.44 | $21.63 |
Indiana, Kentucky and Ohio all three offer economic development incentives at the local and state level. Ohio brings substantial programmatic economic development funding for corporate site location projects, but Indiana and Kentucky can pass state legislation for large scale projects.
Indiana v. Kentucky v. Ohio Economic Development Incentive Comparison
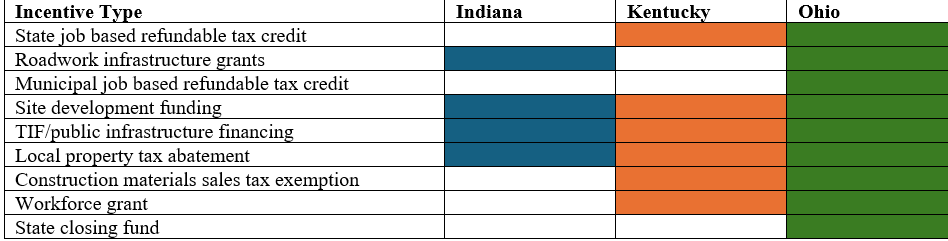
Based upon this competitive market review, the Montrose Group would identify the following advantages and disadvantages from an economic development perspective impacting corporate site selection for Indiana, Kentucky and Ohio.
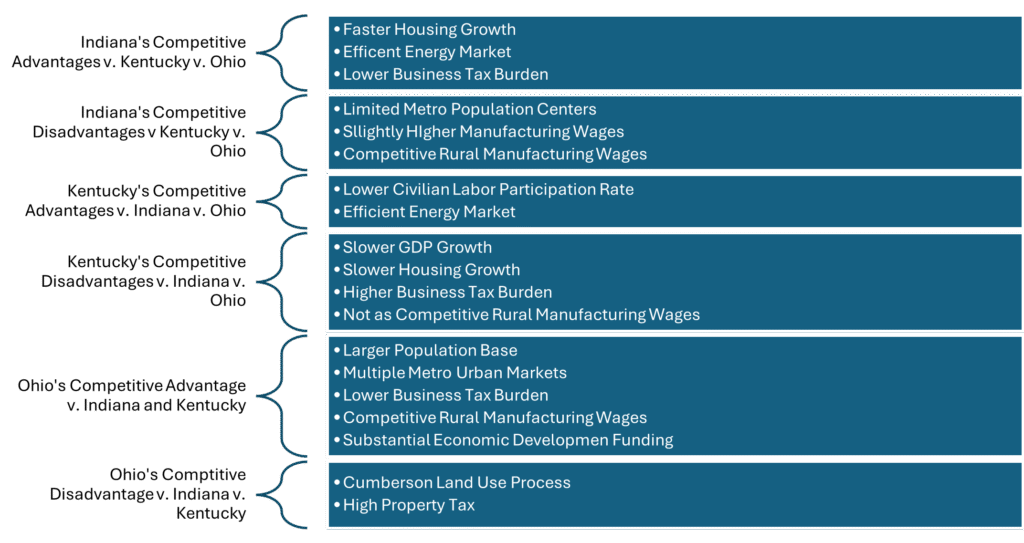
Indiana, Kentucky and Ohio are strong economic markets attractive to a wide range of industries, and a comparison of these markets illustrates the relative strengths and weaknesses that a company should consider for corporate site location purposes.
U.S. Economy and Global Trade: Defining US Trading Partners
The U.S. economy and its 345 million citizens are dependent on global trade. As the percentage of U.S. manufacturing jobs has declined dramatically and the logistics industry has boomed—American consumers do not have fewer choices for goods but more—that is driven by goods manufactured outside of the United States and shipped to U.S. shores.
Constituting less than 5 percent of the world’s population, Americans generate and earn more than 20 percent of the world’s total income. America is the world’s largest national economy and leading global trader. The U.S. Bureau of Economic Analysis, estimated in 2023 that the United States exported $258.2 billion worth of goods and services and imported $320 billion, but the U.S. economy is far less trade-oriented than many other countries around the world. A World Bank analysis using data from 2022 found the U.S. trade-to-GDP ratio — the value of imports and exports as a percentage of the country’s gross domestic product — was 27%. For comparison, the global average is 63%.
However, business and national security issues have arisen with the impact of global trade on the U.S. economy. Rightly or wrongly, global trade is blamed for the loss of U.S. manufacturing jobs. As the chart below shows, U.S. manufacturing jobs maxed out in 1979 with 19,553,000 constituting over 21% of the U.S. economy. Today, U.S. manufacturing jobs total only 12,887,000 and its value to the U.S. economy has been cut in half as manufacturing only constitutes 10% of the nation’s GDP. The late 1970s did see the influx of global steel that could be blamed for the decline of the U.S. steel and auto industry. Of course, the production of gas guzzling cars with consumers facing rising oil prices and anti-competitive labor agreements could be more to blame for the decline of American manufacturing.
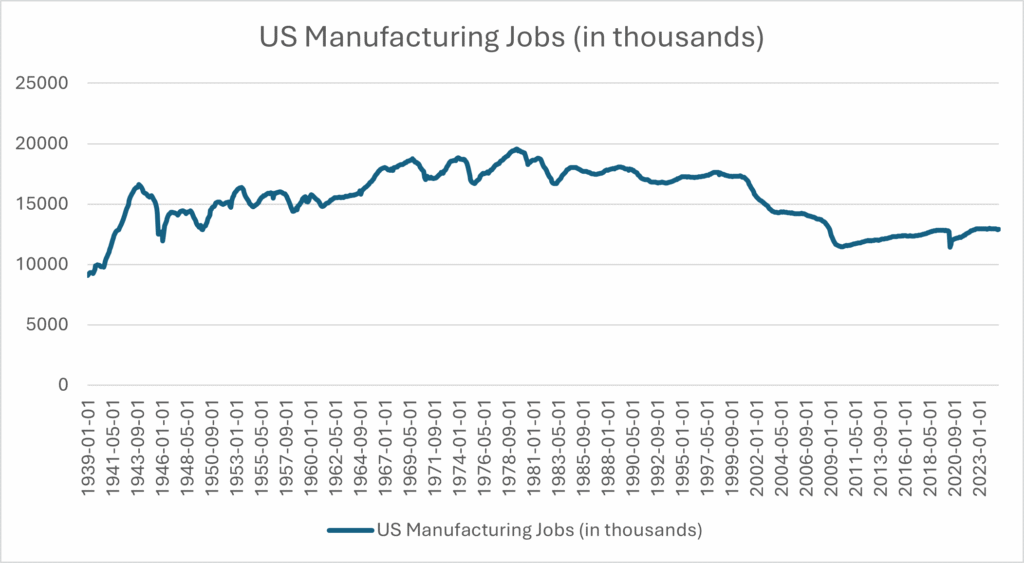
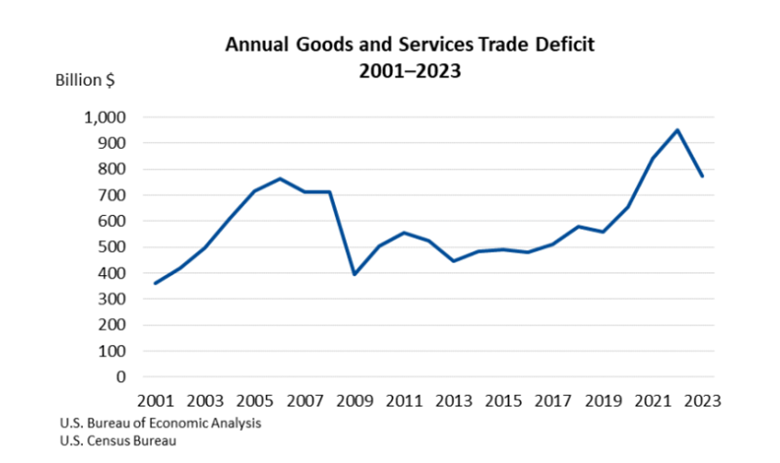
Regardless of the policy basis, the trade deficit is seen as a substantial public policy challenge. The U.S. goods and services trade deficit decreased from $951.2 billion in 2022 to $773.4 billion in 2023, as exports increased, and imports decreased.
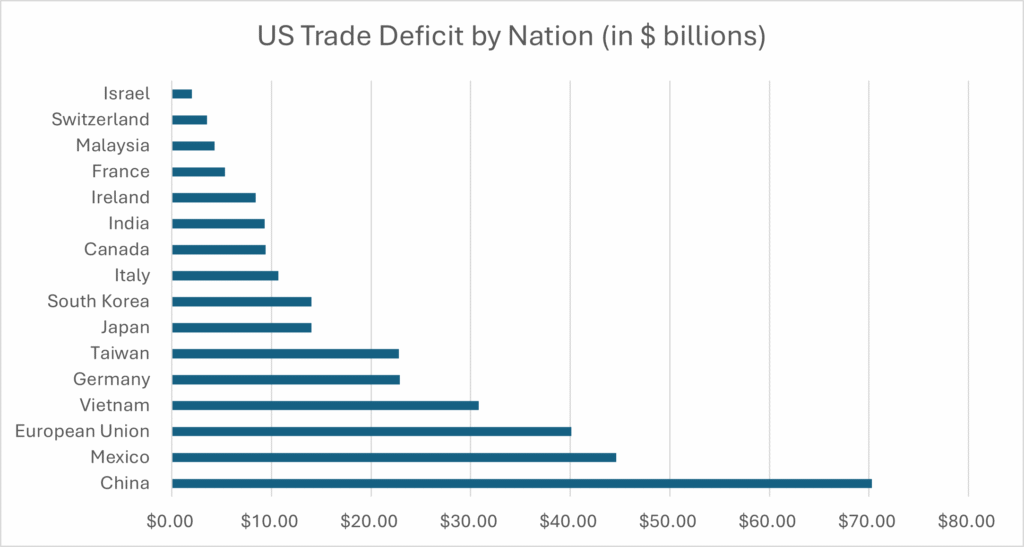
The U.S. trade deficit is concentrated on just a few, very large global markets as illustrated by the graph below with China leading the list of the largest importers into the United States.
Source: St. Louis Federal Reserve FRED
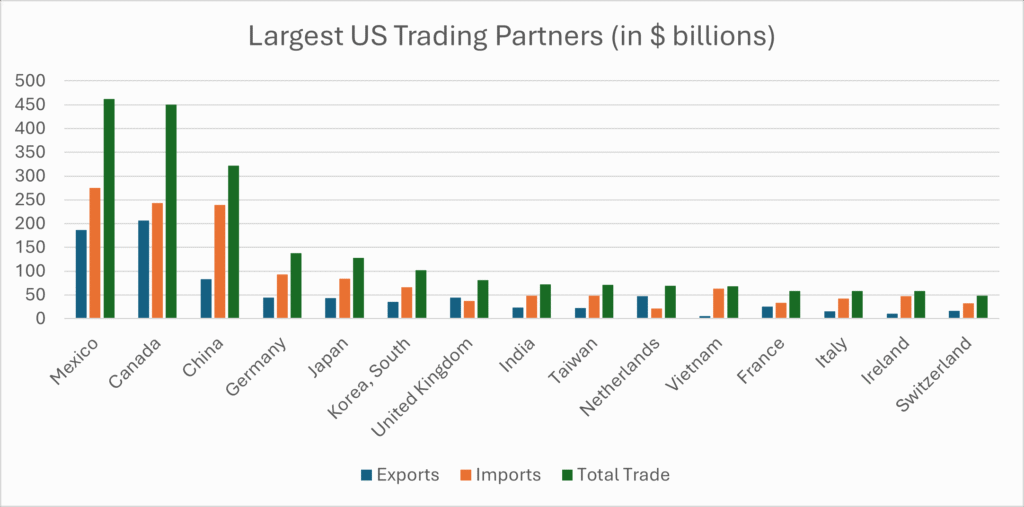
While China dominates the U.S. trade deficit, America’s neighbors, Mexico and Canada, are actually the U.S.’s largest trading partners with substantial imports and exports. As the table below illustrates, China’s large importing of products is not off set by U.S. exports to this market. In fact, U.S. corporations from Starbucks to Apple are reporting a complete lack of success in succeeding in the Chinese marketplace.
Source: U.S. Census Bureau
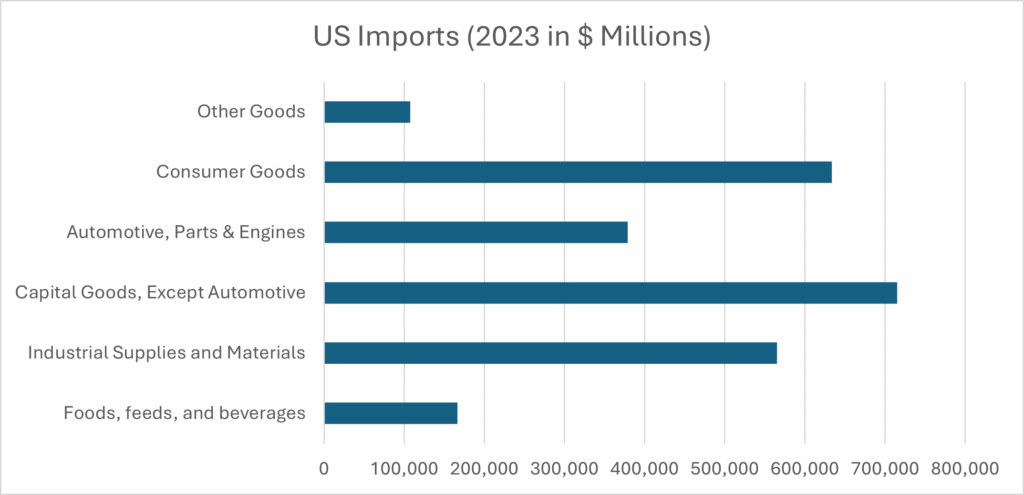
The U.S. imports a wide range of consumer goods and business to business products as illustrated by the chart below with lower percentages for food, feeds and beverages illustrating the domestic strength of the American agriculture industry.
Source: U.S. Census Bureau
Breaking down what products are imported even more is the list below of the top 10 products imported into the United States by industry. This list illustrates where global markets and trade policy are helping U.S. global competitors succeed among American consumers and businesses.
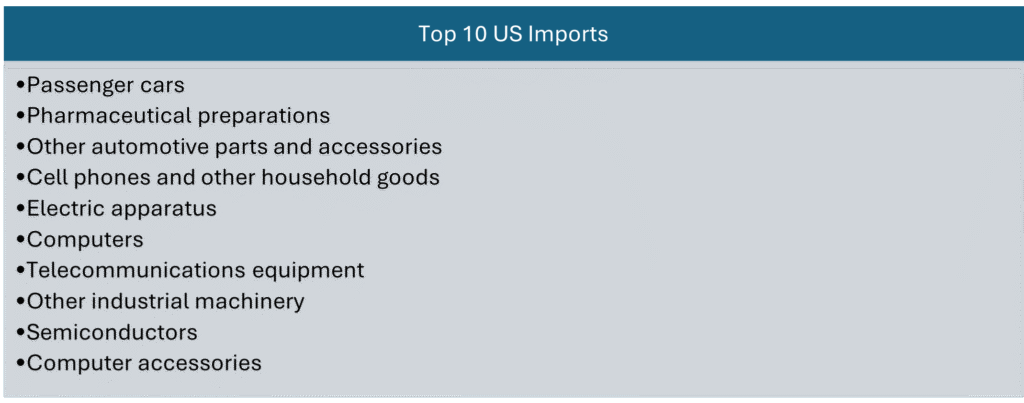
Source: U.S Census Bureau
The chart below illustrates the U.S. industries leading importing products from global markets.
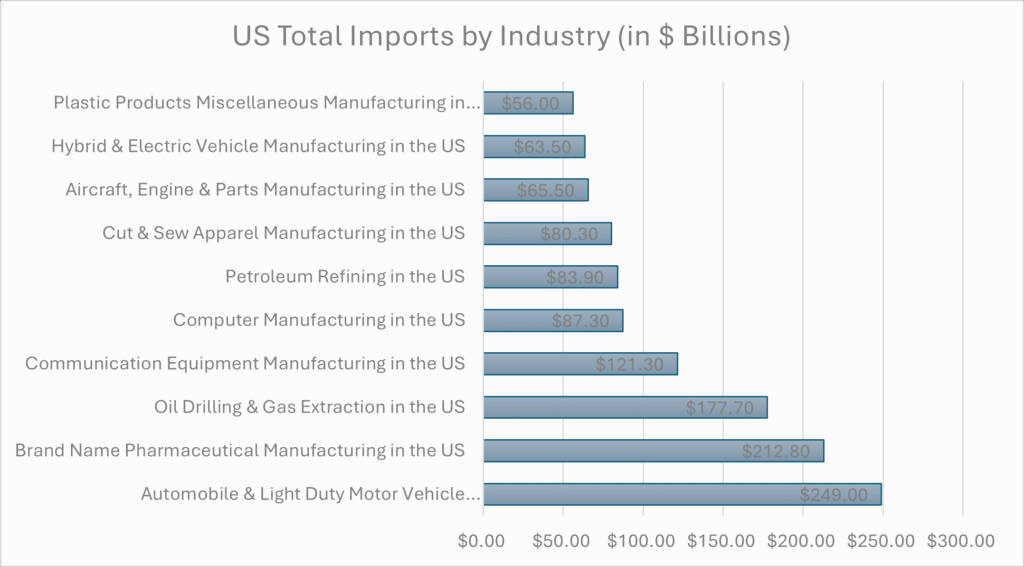
Source: IBIS World
Global trade impacts companies and consumers alike with many of the cars, drugs, telephones, clothes and other products purchased everyday imported from global markets.
Tariff Debate Could Impact Products from China, Mexico, Canada and Others
For economic, public safety and political purposes, China, Mexico and Canada are at the forefront of trade policy debate in Washington with the Trump Administration. More countries than these three might be in the Trump bullseye for tariffs but these three counties are on the top of the list and are major trading partners with the United. States.
The table below illustrates what products China currently imports the most of into the U.S. market and what products could be the topic of trade challenges including electronics, energy production, toys, furniture, and plastics.
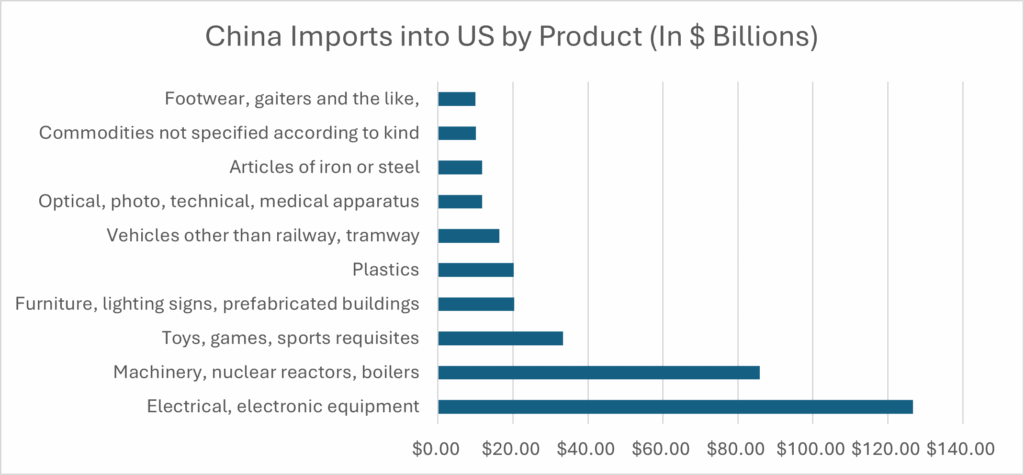
Source: Trading Economics
The table below illustrates the products that lead the import list from Canada into the United States with energy, automotive and energy production leading the list.
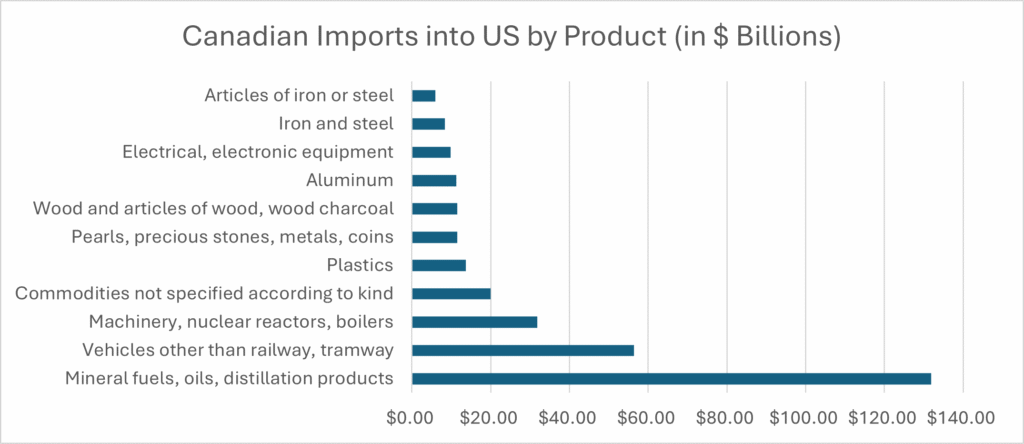
Source: Trading Economics
Finally, as the chart below illustrates, Mexico’s largest imports into the United States are dominated by automotive, electrical machinery, and energy production equipment.
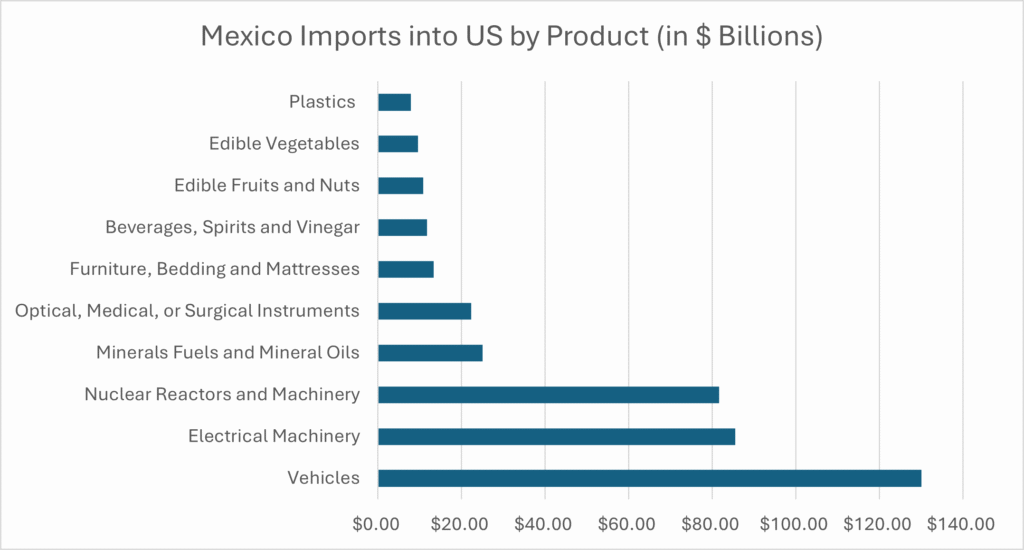
Source: https://www.usimportdata.com/
Understanding what these three countries import into the United States provides three critical data points for companies and communities:
- tells American companies where their next supply chain challenge will come from,
- identifies potential Foreign Direct Investment (FDI) targets for regions and states, and
- tells consumers which products will cost more if tariffs are added to them.
Supply Chain and Political Strategies Needed for Companies Preparing for Trump Tariffs
Preparing for President Trump’s trade tariffs is essential for companies and communities. Tariff impact strategies need to include preparing a company’s supply chain and getting engaged in the lobbying process to limit the damage of potential trade tariffs on a company and the community they serve.
First, let’s talk about what a tariff is. Tariffs are a form of tax applied on imports from other countries. The most common kind of tariffs are ad valorem, which are levied as a fixed percentage of the value of the imports. There are also “specific tariffs,” which are charged as a fixed amount on each imported good (for example, $2 per shirt) and “tariff-rate quotas,” which are tariffs that kick in or rise significantly after a certain number of imports is reached (e.g., fifty thousand tons of sugar). Economists say the costs are largely passed on to consumers, and countries have used them to protect domestic industries, such as agriculture and renewable energy, as well as to retaliate against other states’ unfair trade practices. President Trump wielded tariffs more than any recent American president, particularly against China during his first term and has promised tariffs against China, Mexico, Canada and other countries. Trump is not alone- President Biden has largely left the original Trump tariffs in place during his four years in the White House. 130 years ago, before a Constitutional Amendment was passed permitting the income tax, Republicans ran the federal government on tariff revenues and protecting a young, American manufacturing industry.
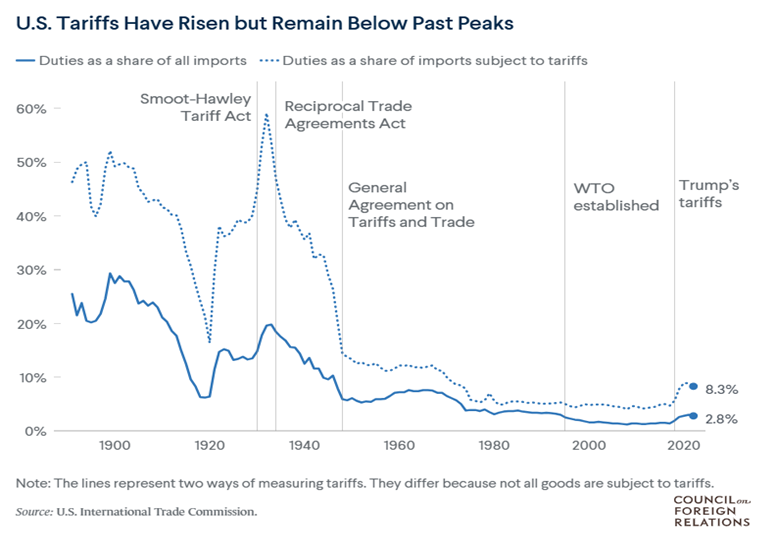
By supporting the creation of the GATT and the WTO, the United States Congress sought to reduce tariff rates globally within a rules-based trading system. Roughly 70% of all products enter the United States duty free according to the Congressional Research Service.
Let’s start talk politics. The Constitution grants Congress the power to lay and collect duties and to regulate commerce with foreign nations. Because tariffs are no longer a major element of domestic tax policy, they have instead become an instrument of U.S. foreign policy and trade promotion. Congress often works with the President to set tariff policy by authorizing the President to negotiate trade agreements and to adjust tariffs in certain circumstances. Congress in 1974 established expedited procedures to enact implementing legislation for trade agreements addressing nontariff barriers. Under these procedures, currently known as Trade Promotion Authority (TPA), Congress establishes U.S. trade negotiating objectives as well as consultation and notification requirements. If the President satisfies these objectives and requirements, implementing legislation for an agreement may receive expedited treatment including an “up or down vote” without amendment. The most recent TPA, the Bipartisan Comprehensive Trade Priorities and Accountability Act of 2015, expired in the summer of 2021. In dozens of statutes, Congress has authorized the President to adjust tariff rates in response to specific trade-related concerns related to U.S. foreign policy and national security interests, or that require an administrative finding by a U.S. agency. Congress has also empowered U.S. agencies to impose duties to offset certain injurious trade practices. Impacting federal tariffs is a political process that requires effective lobbying to shape the policy that is adopted.
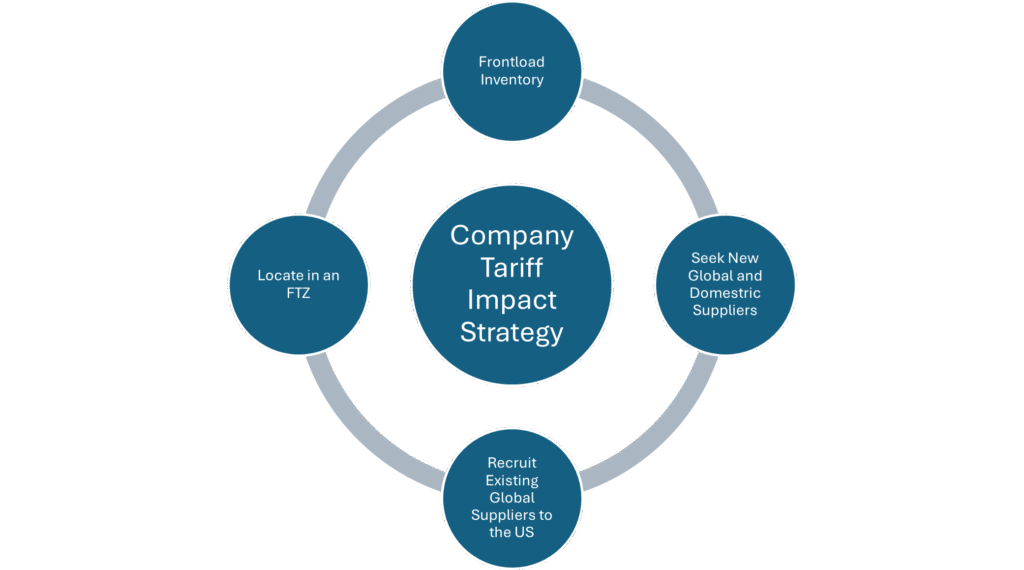
Dealing with the impact of tariffs does not just involve politics but smart supply chain management strategies can help minimize their negative impact. Supply chain strategies include:
- Frontloading inventory, stockpiling inventory in a warehouse, is a short-term tariff solution that can be a critical part of a longer-term strategy to address supply chain short falls caused by federal tariff policy.
- Identifying alternative, global sources to replace global suppliers is a better long-term tariff solution as countries like Vietnam, India, Turkey and parts of Europe like Poland have also become more commonplace locations from which to source goods.
- Recruiting global suppliers to the United States is the best long-term solution to tariffs as this meets the policy and economic goal of the politicians and builds a predictable supply chain that likely costs more—but potentially less than global goods pay under a tariff.
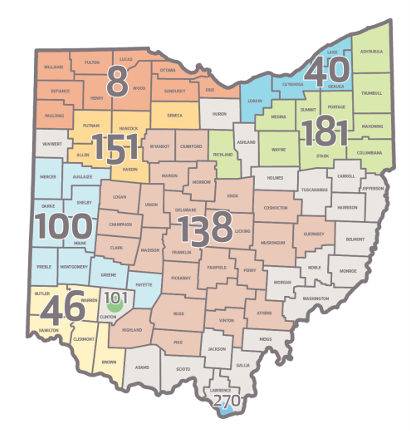
- Locating a manufacturing facility in a Foreign Trade Zone (FTZ) minimizes the impact of tariffs. FTZs permit foreign and domestic merchandise to be moved into zones for operations, including storage, exhibition, assembly, manufacturing, and processing. FTZs sites are subject to the laws and regulations of the United States as well as those of the states and communities in which they are located. Customs duties and federal excise tax, if applicable, are paid when the merchandise is transferred from the zone for consumption, and, while in the zone, merchandise is not subject to U.S. duty or excise tax, certain tangible personal property is generally exempt from state and local ad valorem taxes. Goods may be exported from the zone free of duty and excise tax. Ohio is home to nine FTZs, including: FTZ No. 8 – Toledo, FTZ No. 40 – Cleveland, FTZ No. 46 – Cincinnati, FTZ No. 100 – Dayton, FTZ No. 101 – Clinton County, FTZ No. 138 – Columbus, FTZ No. 151 – Findlay, FTZ No. 181 – Akron, and FTZ No. 270 – Lawrence County.
Succeeding a world with higher U.S. tariff rates requires planning, lobbying and smart supply chain strategies all coordinated with a thoughtful and strategic plan.