Please Join the Montrose Group for the Development Opportunity 2024 Forum on May 21, 2024
Network with company executive leaders, local / state government and economic development officials, real estate and business professionals as we share the latest economic development issues impacting corporate site location decisions.
Development Opportunity 2024 Forum Registration Link:
https://www.eventbrite.com/e/819136779157?aff=oddtdtcreator

Montrose Group Determines Unmet Residential Demand Exists in Gallia County, Ohio
In October 2023, the Gallia County Community Improvement Corporation (CIC) partnered with the Montrose Group, LLC to conduct a comprehensive housing market analysis for Gallia County. Demand for new residential development is surging in Gallia County and its neighboring areas due to the announcement of major projects such as NUCOR Corporation’s new steel mill, The Appalachian Regional Clean Hydrogen Hubs (ARCH2), and Mountaineer GigaSystems’ clean hydrogen and natural gas facility.
There’s an estimated 3,470 new jobs expected to be created in the Appalachia region surrounding Gallia County soon. To effectively leverage these future developments and employment centers, Gallia County is undertaking a thorough examination of its housing inventory in preparation. This comprehensive housing market analysis will assist the leadership in Gallia County in finding creative solutions to the housing difficulties that the County faces. The Montrose Group housing study recommends that Gallia County double the total available new and remodeled housing stock within Gallia County over the next five years by redeveloping the Gallia County town centers to retain and attract a younger demographic. Other recommendations include:
- Engaging the Gallia County Land Reutilization Corporation to actively gain state funding to prepare sites for residential development
- Reviewing local zoning regulations in Gallia County and amend them to foster residential development
- Embracing single and multi-family residential projects through the use of local economic development tax incentives
- Preparing sites for residential development while also recruiting developers through a comprehensive marketing campaign
Kentucky, Ohio, and Virginia’s Corporate Site Location Process Illustrates Different Approaches to Retaining and Creating High-Wage Jobs
Kentucky, Ohio, and Virginia offer interesting markets for corporate site location projects. Companies considering these markets need to understand the corporate site location process and dig into the demographic, macroeconomic, workforce, industry cluster, and other research critical to determining if a market is growing and capable of serving a company’s project. Next, a company must determine if these markets offer a competitive cost of doing business, what sites are ready for investment, and what economic development incentives are offered to address competitive imbalances.
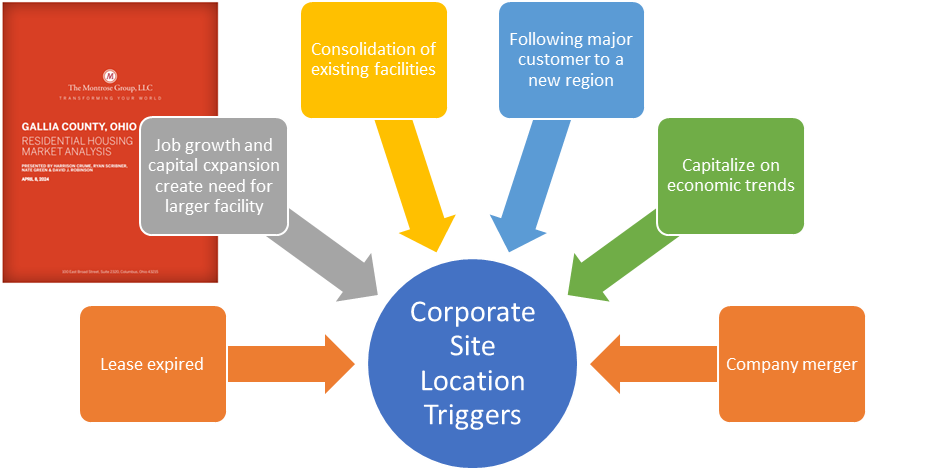
The corporate site location process helps companies decide where to locate, and this process entails a lot more than tax incentives. Triggers such as the end of a real estate lease, growth needs beyond the current facility, decay of the existing facility, consolidation of existing facilities, a growth opportunity tied to a customer, a merger of companies, or a company seeking to capitalize on an economic trend are signs that a company should undertake a corporate site location project.
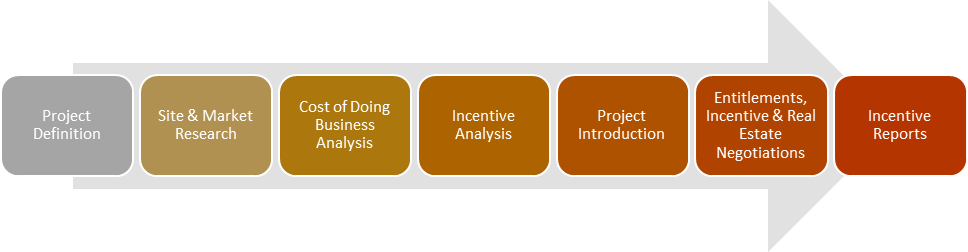
- Define the project to learn about the industry, the number of jobs, payroll, and capital investment planned by a company, needs for the project site, and geographic markets that fit the company’s business plan leading to the creation of potential state and regional target list for the company’s location.
- Conduct market research to understand the economic analysis of growth, industry cluster, labor shed, transportation, infrastructure, and supply chain of an industry, company, and region and potential real state options for each of these markets.
- Review sites in these states and regions as well as the real estate, labor, and tax policy as all of these impact the cost of doing business.
- Analyze relevant infrastructure finance programs and economic development incentives.
- Narrow the search to a handful of sites in the states and cities that fit the company’s business purpose.
- Send a confidential Request for Proposal or project letter using a corporate site location consultant or legal counsel that outlines the nature of the corporate site location project and the specific needs of the company related to the site in question with specific infrastructure, workforce, incentive, and site needs.
| Montrose Group Corporate Site Location Process |
Regional economic development organizations, most often public-private partnerships at the local level and a mix of public and private organizations at the state level help guide the corporate site location process once a company is ready to focus on specific geographic markets and sites. In the Great Lakes States, regional economic development organizations could be large multi-county private sector organizations charged with negotiating corporate site location projects such as the Geater Richmond Partnership, Greater Louisville, BE NKY, Commerce Lexington, One Columbus, Team NEO, Ohio SE, Dayton Development Coalition, Regional Growth Partnership, REDI Cincinnati, and state economic development organizations such as the Kentucky Cabinet for Economic Development, Virginia Economic Development Partnership, and JobsOhio. City and county governments may often be involved as well in supporting corporate site location, negotiating economic development incentives as well as even awarding economic development incentives.
Kentucky’s model for economic development is driven by state government, with economic development organizations often helping at the local and regional levels. However, Louisville seems to be shifting back to the city government driving economic development for the city. Virginia and Ohio are primarily using private sector economic development organizations at the state and regional level to market the states. Economic development incentive decisions in Virginia remain with the state government while most incentive decisions in Ohio are with the private sector organization JobsOhio. However, local economic development incentive decisions in Ohio are decided by local governments.
In addition, land use entitlements such as zoning and annexation are completely a local government decision.
Kentucky, Ohio, and Virginia’s Demographic Analysis Impacts Corporate Site Location Decisions.
The demographic measures of Kentucky, Ohio, and Virginia offer a good starting point for measuring the economic vitality of these states for companies considering a corporate site location project.Key demographic measures that impact corporate site location decisions include total population and population growth which impact the ability of a region to provide skilled workers—the larger the population pool the more chances for creating a skilled worker. Also, homeownership and median home value illustrate whether workers will be able to afford housing. Labor issues such as the level of higher education degree attainment and how many workers are in the active workforce impact a region’s ability to attract companies, especially if they have no room for growth in the active labor market. The Quality of life in an area, such as commute times to work, matter as well and overall wealth measures, such as median household income and poverty rate, impact company location decisions.
Kentucky, Ohio & Virginia Demographic Profile
| Fact | Kentucky | Ohio | Virginia |
| Population (2022) | 4,526,154 | 11,785,935 | 8,715,698 |
| Population Growth 2020-22 | 0.1% | -0.3% | 0.6% |
| Home Ownership Rate | 68.1% | 66.8% | 66.9% |
| Median Home Value | $177,000 | $183,000 | $339,800 |
| Bachelor’s Degree Rate | 26.5% | 30.4% | 41.0% |
| Civilian Labor Participation Rate | 59.2% | 63.1% | 63.8% |
| Commute Time | 23.9 | 23.6 | 27.9 |
| Median Household Income | $60,183 | $66,990 | $87,249 |
| Poverty Rate | 16.5% | 13.4% | 10.6% |
Source: US Census Bureau
As the table above illustrates, Virginia’s population grew slightly in recent years while Ohio and Kentucky lost population. All three states have strong home ownership numbers and driven by the large and expensive Washington DC metro region, Virginia’s statewide median home value is much higher than Ohio and Kentucky. Kentucky has a lower workforce participation rate and household income levels and a higher poverty rate likely driven by the large Appalachian region that dominates rural Kentucky.
The demographic measures of major cities have a big impact on corporate site location decisions. A comparison of the metro regions in Kentucky, Ohio and Virginia illustrates population growth in most areas other than the Cleveland region, common home values with Richmond slightly higher. All of these metro areas have a highly educated workforce with above average income levels and poverty rates near the national average.
Metropolitan Statistical Area Demographic Benchmark Comparison
| Fact | Louisville | Richmond | Lexington | Cincinnati | Cleveland | Columbus |
| Population 2023 | 1,365,557 | 1,349,732 | 520,045 | 2,271,479 | 2,063,132 | 2,180,271 |
| Population Growth 2020 to 2023 | 0.2% | 2.5% | 0.5% | 0.9% | -1.1% | 1.8% |
| Homeownership Rate | 69.2% | 67.6% | 59.6% | 69.1% | 66.6% | 61.2% |
| Median Home Value (2022) | $245,700 | $336,500 | $270,300 | $248,700 | $209,000 | $282,200 |
| Bachelor’s Degree or Higher Rate | 35.3% | 42.2% | 42.1% | 36.9% | 36.1% | 40.0% |
| Civilian Labor Participation Rate | 65.9% | 65.9% | 66.6% | 65.8% | 63.2% | 67.5% |
| Mean Commute Time | 23.8 | 24.8 | 21.7 | 25.2 | 24.2 | 23.5 |
| Median Household Income | $69,547 | $81,388 | $65,964 | $75,062 | $65,198 | $75,777 |
| Poverty Rate | 12.1% | 10.7% | 14.0% | 11.8% | 13.7% | 12.4% |
Source: US Census Bureau, Federal Reserve of Economic Data (FRED)
Population growth is a critical measure of economic success. A growing population base creates a larger pool of workers which attracts companies struggling to find skilled labor. As the table below illustrates, other than Cleveland, these metro regions are all growing with Columbus leading these cities among population growth
| MSA Population Growth | ||||||
| Year | Louisville | Richmond | Lexington | Cincinnati | Cleveland | Columbus |
| 2023 | 1,365,557 | 1,349,732 | 520,045 | 2,271,479 | 2,055,938 | 2,180,271 |
| 2022 | 1,361,300 | 1,338,238 | 517,748 | 2,258,625 | 2,063,132 | 2,162,066 |
| 2021 | 1,361,424 | 1,326,307 | 516,639 | 2,252,627 | 2,073,183 | 2,146,927 |
| 2020 | 1,362,955 | 1,316,646 | 517,407 | 2,251,974 | 2,086,509 | 2,141,895 |
| 2019 | 1,266,200 | 1,293,983 | 517,721 | 2,225,262 | 2,049,028 | 2,125,507 |
| 2018 | 1,262,810 | 1,282,515 | 515,155 | 2,214,370 | 2,053,841 | 2,105,684 |
| 2017 | 1,260,344 | 1,270,792 | 512,052 | 2,205,111 | 2,057,650 | 2,084,070 |
| 2016 | 1,253,093 | 1,259,571 | 506,042 | 2,193,676 | 2,061,358 | 2,053,509 |
| 2015 | 1,246,817 | 1,247,430 | 501,782 | 2,183,071 | 2,064,569 | 2,028,506 |
| 2014 | 1,239,825 | 1,235,618 | 495,381 | 2,173,558 | 2,067,793 | 2,002,402 |
| 2013 | 1,232,541 | 1,223,065 | 491,089 | 2,163,183 | 2,067,461 | 1,974,649 |
| 2012 | 1,220,448 | 1,211,395 | 485,365 | 2,153,475 | 2,065,018 | 1,947,602 |
| 2011 | 1,212,009 | 1,197,332 | 479,004 | 2,146,885 | 2,069,115 | 1,926,556 |
| 2010 | 1,204,684 | 1,188,423 | 473,425 | 2,140,963 | 2,075,476 | 1,906,408 |
| Percent Change | 13.35% | 13.57% | 9.85% | 6.10% | -0.94% | 14.37% |
| Number Change | 160,873 | 161,309 | 46,620 | 130,516 | -19,538 | 273,863 |
| Source: Federal Reserve of Economic Data (FRED) | ||||||
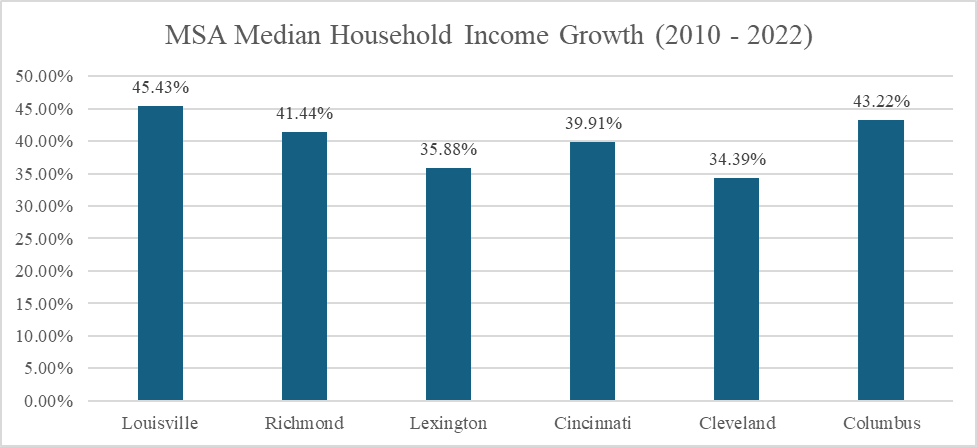
Median household income refers to the income level earned by a given household where half of the households in the geographic area of interest earn more and half earn less as measured by the U.S. Census Bureau. Median household income is an important demographic measure as it tells companies the relative wealth of a geographic region. The chart below compares the median household income of major cities in Kentucky, Ohio, and Virginia. These regions all have growth slightly below the national average for median household income.
Kentucky, Ohio, and Virginia Enjoy Growing Economies Attractive for Corporate Site Location Projects
The economic growth of a region and state impacts corporate site location decisions. Economic growth is measured by comparing the vitality of the state through a long-term review of Gross Domestic Product growth. For companies seeking a large pool of skilled workers, large to mid-sized urban markets are often targets for future economic growth.
Comparing regional gross domestic product growth is a critical economic development measure that companies consider. A region’s gross domestic product is the sum of its total economic output for the public and private sectors. Regions with growing economies are generally more attractive to companies considering a corporate site location decision. As the below illustrates, Kentucky, Virginia, and Ohio compare well in the region in overall economic output.
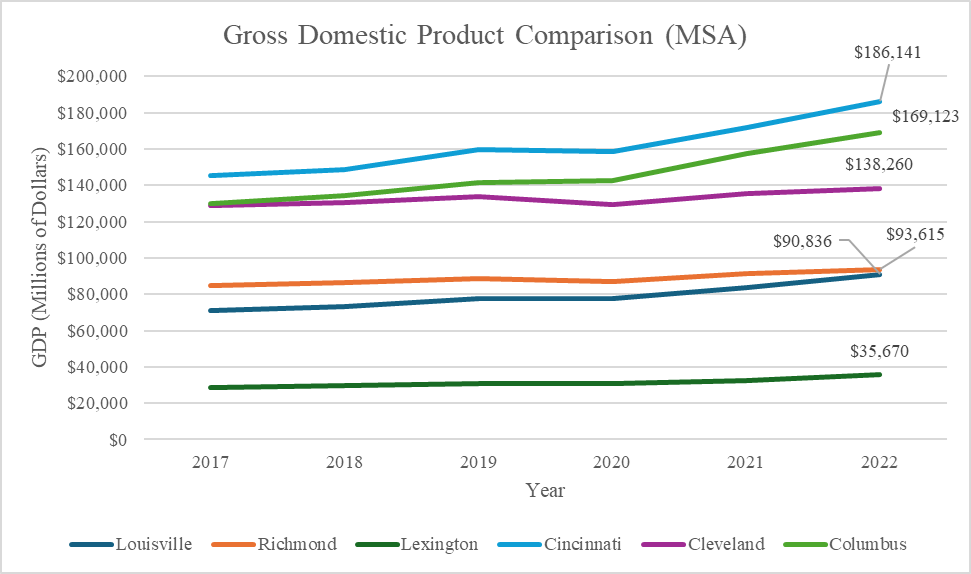
Measuring the regional economic output of the major urban areas is another critical data point for companies to review related to corporate site location projects. As the chart below illustrates, the major metro regions in Kentucky, Ohio, and Virginia have been growing with Columbus and Cincinnati leading the pack on economic output with this benchmark comparison.
Kentucky, Ohio, and Virginia Illustrate Diverse Economies Impacting Corporate Site Location Decisions
Another important measure for companies to consider when researching regions for a corporate site location decision is the region’s concentration in the company’s industry. Industry clusters are regional concentrations of related industries.[i] Clusters consist of companies, suppliers, and service providers, as well as government agencies and other institutions that provide education, information, research, and technical support to a regional economy.[ii] Clusters are a network of economic relationships that create a competitive advantage for the related firms in a particular region, and this advantage then becomes an enticement for similar industries and suppliers to those industries to develop or relocate to a region. A location quotient is an indicator of the economic concentration of a certain industry in a state, region, county, or city compared to a base economy, such as a state or nation that measures industry clusters in a region. A location quotient greater than 1 indicates the concentration of that industry in the area. A location quotient greater than 1 typically indicates an export-oriented industry. An industry with a location quotient of 1 with a high number of jobs present is likely a big exporter and is bringing economic value to the community feeding the retail trade and food services sectors.
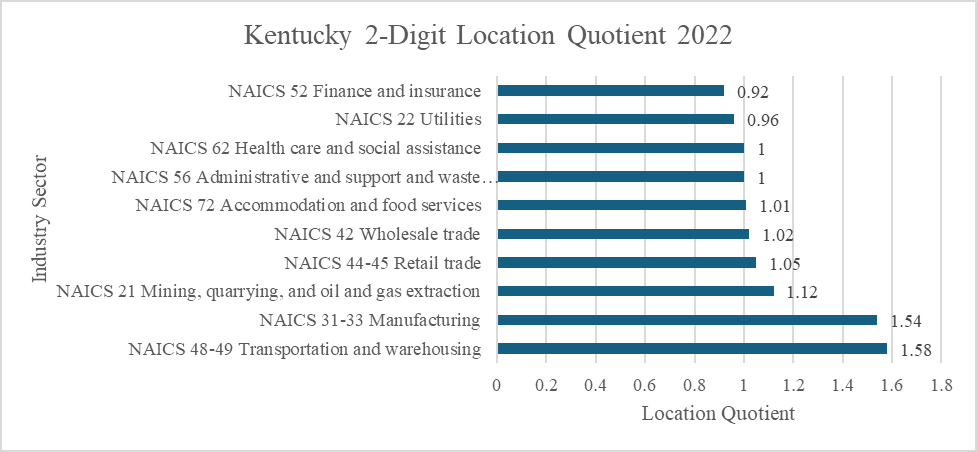
Kentucky’s industry strength lies in manufacturing, as well as transportation and warehousing. Additionally, mining, retail, wholesale trade, accommodations and food, administration, and health care are all above the national average as illustrated by the table above.
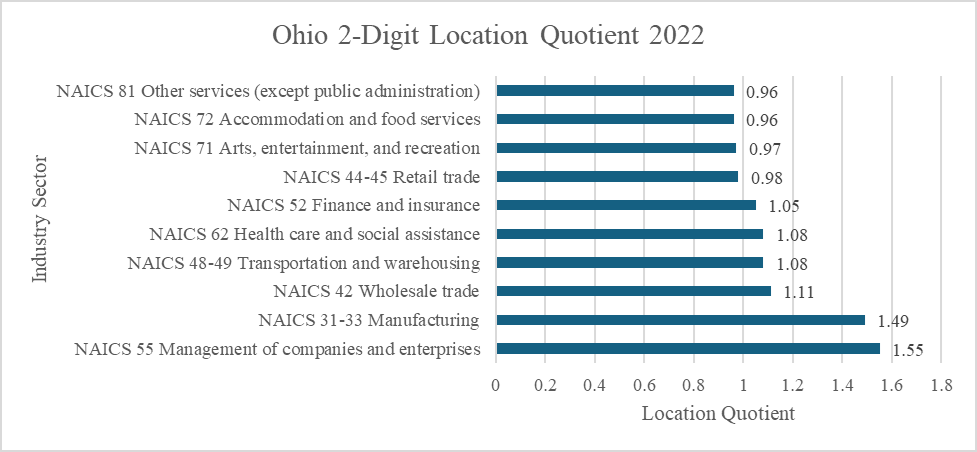
As illustrated by the table above, Ohio has a strong industry base in company management and manufacturing and is above average from an industry standpoint for wholesale trade, transportation and warehousing, health care, and financial services.
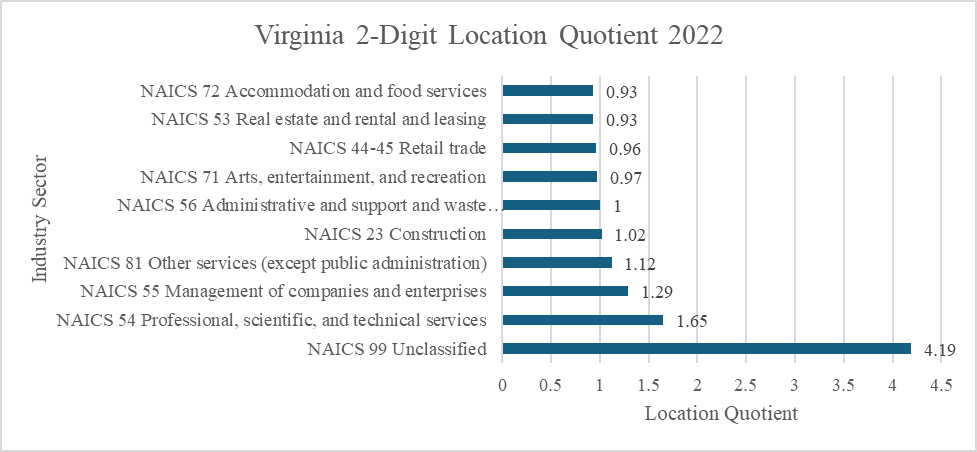
Finally, Virginia’s industry strengths are focused on professional service firms, management, services, construction, and administration illustrating the strong advanced services nature of the economy.
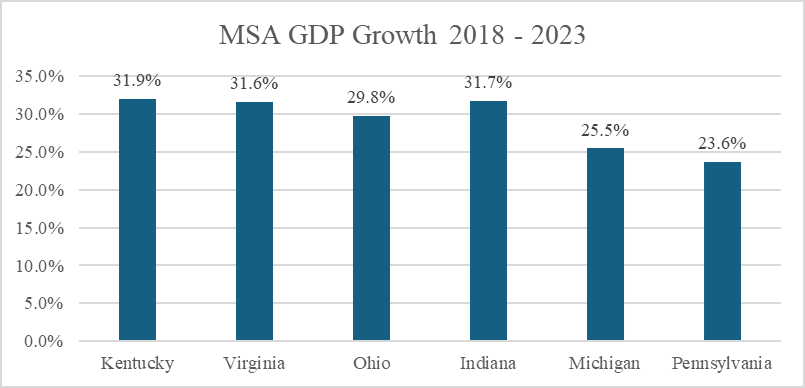
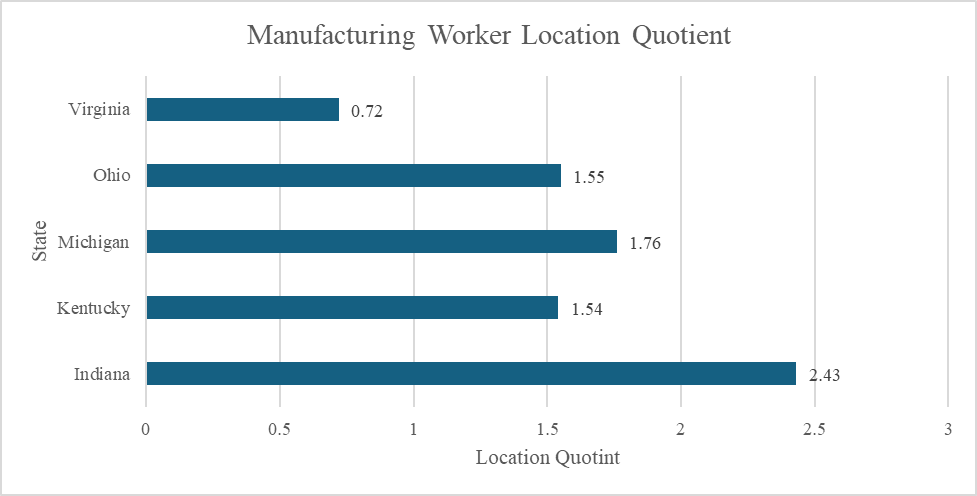
As the table below illustrates, Kentucky and Ohio have an above-average number of manufacturing production jobs with Indiana leading the list of having a higher concentration of manufacturing jobs. Indiana has the highest concentration of manufacturing production workers in the United States.
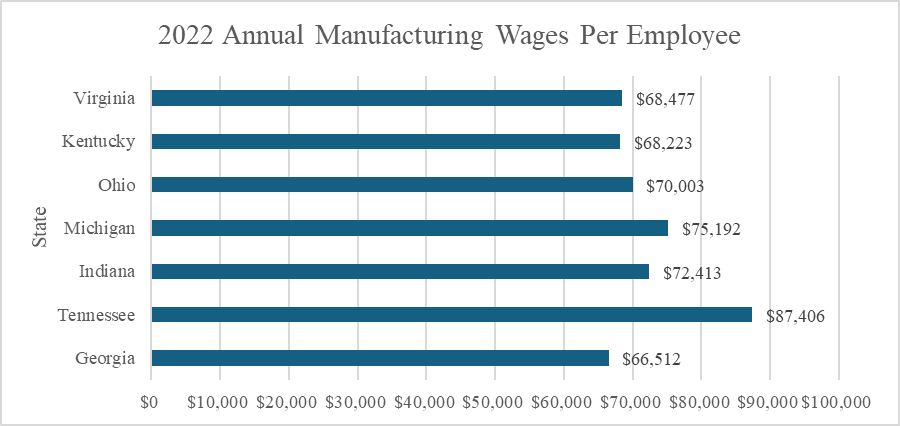
Wage rates for manufacturing projects have an impact on corporate site location projects for these industries. As the table below illustrates, Virginia, Kentucky and Ohio remain cost competitive for manufacturing wages compared to Michigan, Indiana, and Tennessee with Georgia at the lowest average rate.
Kentucky, Ohio, and Virginia’s Tax Policy Impacts Corporate Site Location Projects
Taxes levied by local and state governments have a major impact on a company’s corporate site location decisions. What and how much a local or state government may tax businesses is a policy decision related to the revenues needed to pay for schools, roads, water, public safety, and other essential services, but is also a public policy decision impacting a company’s corporate site location.
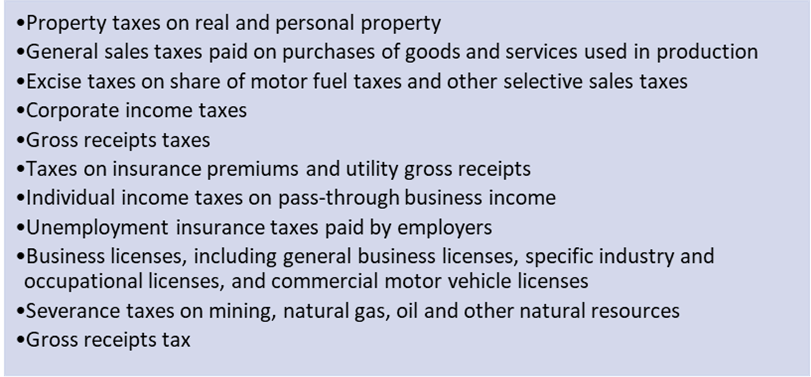
Property taxes are the highest business tax in nearly all the states and all these states have some form of an income tax. An important factor for companies to consider when reviewing this state and local tax data is what taxes will their company pay more. Large-scale industrial investments will drive up property taxes if the state taxes equipment. Some states have property taxes on inventory which impacts individual companies differently. Finally, companies in the advanced service, white collar, or technology industries may not put a heavy em[hasis on property tax as they have moved to a near virtual office presence and won’t pay substantial property taxes.
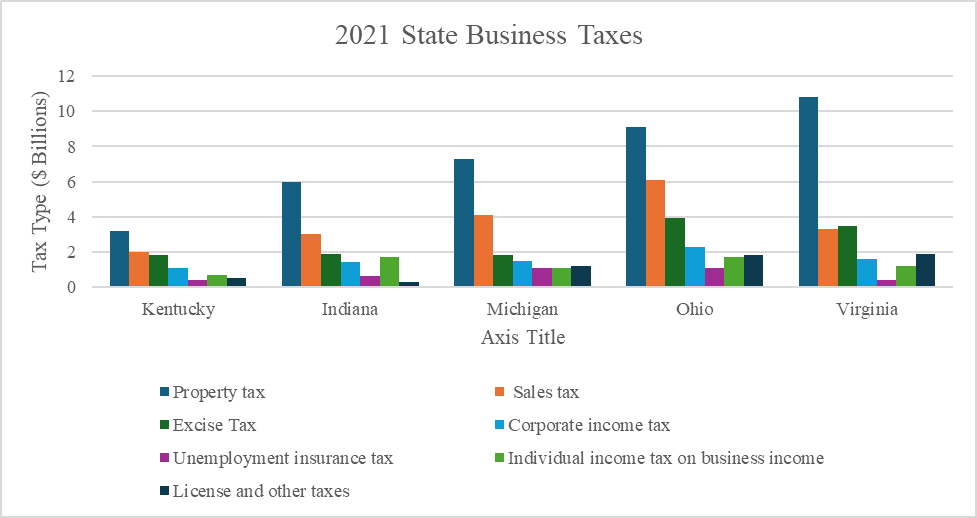
As the table below illustrates, property taxes are the dominant taxes most companies pay in Kentucky, Indiana, Michigan, Ohio and Virginia and all of these states under review operate with some form of income tax which spreads the tax burden to individual taxpayers and away from many businesses.
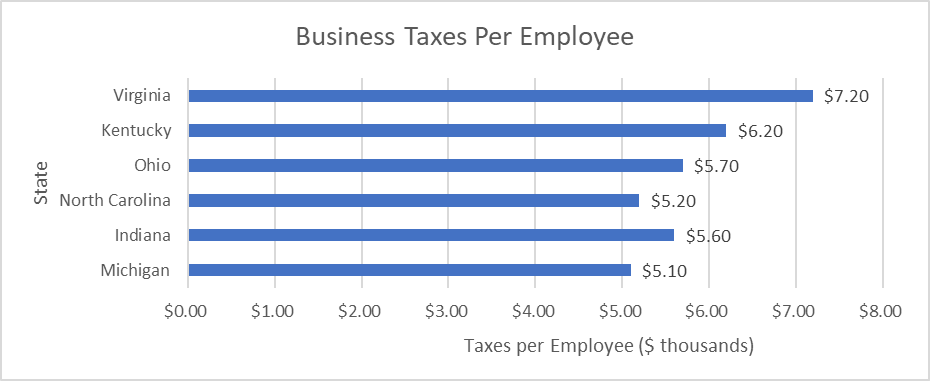
Measuring business taxes on a per-employee basis is a method that can provide a company considering a corporate site location project with a good basis for a state’s overall business-friendly attitude. This approach addresses population differences in the states. As the table below illustrates, Virginia companies share the highest burden of state and local taxes when compared with Kentucky, Ohio, North Carolina, Indiana and Michigan.
Kentucky, Ohio, and Virginia All Offer Aggressive Economic Development Incentives Geared Toward Corporate Site Location Projects
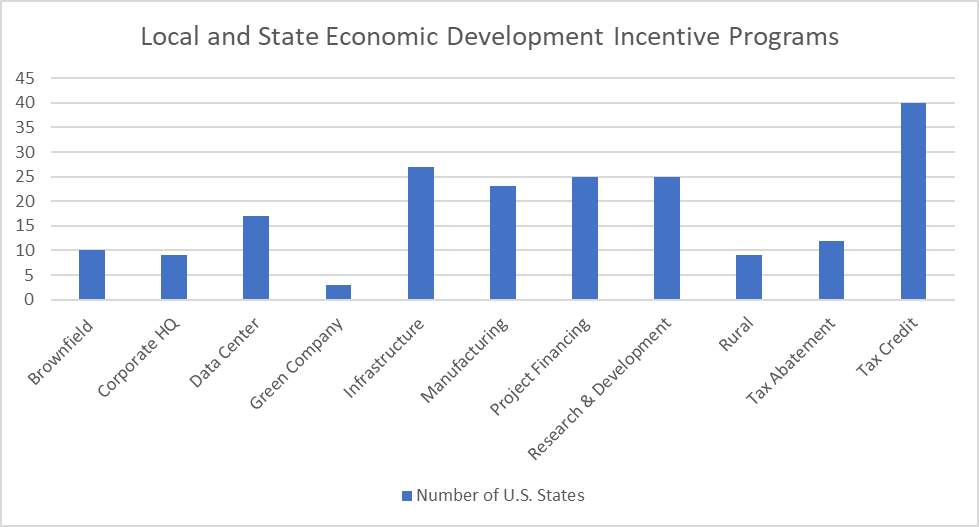
To address the regional cost of doing business factors, all fifty states offer some form of economic development incentives. As the chart below outlines, infrastructure incentives are provided by all the states in the union followed by tax credits as the second most popular tax incentive program in the nation with efforts to attract data centers and using general tax abatements tying for third. Princeton Economics estimates that state and local governments invest about $30 B dollars in economic development incentives annually.
Kentucky, Ohio, and Virginia all offer compelling opportunities for a range of industries considering these states for a corporate site location project.
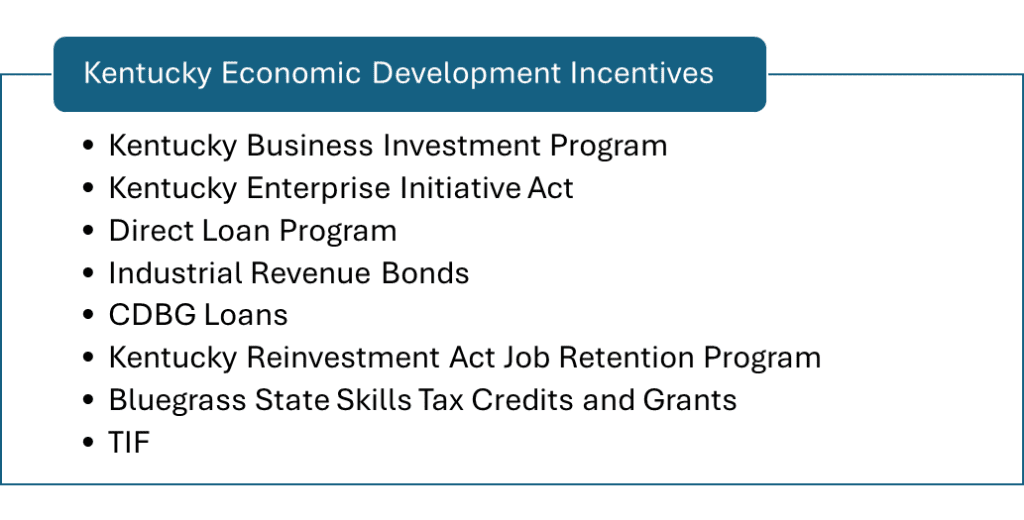
Kentucky Business Incentives. The Commonwealth of Kentucky offers a range of economic development incentives tied to the creation of new high-wage jobs and capital investment.
- Kentucky Business Investment (KBI) Program offers income tax credits and wage assessments for new and expanding businesses in sectors like manufacturing, headquarters operations, and technology-related services. Enhanced incentives are available for projects in certain counties.
- Kentucky Enterprise Initiative Act (KEIA) provides sales and use tax refunds on construction materials, equipment used in research and development, and data processing for approved projects.
- Direct Loan Program supports business expansion with below-market interest rate loans, available for non-retail projects in industries such as agribusiness, tourism, and manufacturing.
- Industrial Revenue Bonds (IRB) allows financing for manufacturing projects, healthcare facilities, and other significant ventures through bonds issued by state governments.
- Community Development Block Grants (CDBG) Loans offer federally funded low-interest loans through the Department for Local Government for community development projects.
- Kentucky Reinvestment Act (KRA): Job Retention program provides tax credits to existing Kentucky companies engaged in manufacturing, agribusiness, non-retail service or technology activities, headquarters operations, hospital operations, coal severing and processing, alternative fuel, gasification, energy-efficient alternative fuels, renewable energy, or carbon dioxide transmission pipelines permanently for a reasonable period that will be investing in eligible equipment and related costs of at least $2,500,000 for owned facilities and $1,000,000 for leased facilities (excluding rent).
- Bluegrass State Skills Corporation Workforce Program offers tax credits and grant reimbursements for employee training.
- Tax Increment Financing (TIF) supports public infrastructure improvements through future tax gains, with several programs tailored to both state and local development projects.
Ohio Economic Development Incentives. Ohio offers a wide range of economic development incentives at the local and state government level as listed below.
Ohio Economic Development Incentive Programs
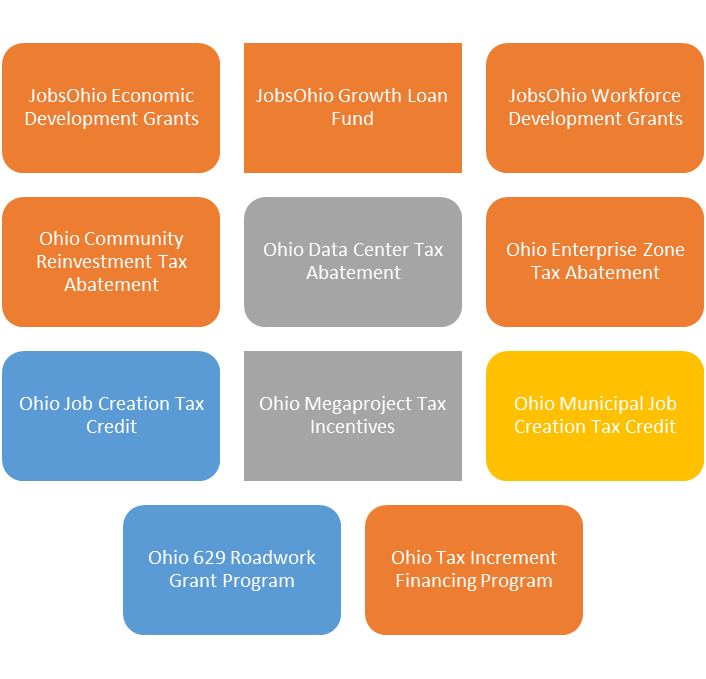
- Jobs Ohio Economic Development Grant promotes development, business expansion, and job creation by providing funding for eligible projects in the State of Ohio
- JobsOhio Workforce Grant was created to promote economic development, business expansion, and job creation by providing funding for the improvement of worker skills and abilities in the State of Ohio. The program requires job creation and training of employees within a specified period and may consider the amount of proceeds per job created and employee trained. JobsOhio may consider aiding for eligible projects that improve operational efficiencies or production expansion, along with the retention of jobs.
- JobsOhio Growth Fund Loan provides capital for expansion projects to companies that have limited access to capital and funding from conventional, private sources of financing. JobsOhio will consider loans to companies that are in the growth, established or expansion.
- Ohio Community Reinvestment Area program is an economic development tool administered by municipal and county governments that provides real property tax exemptions for property owners who renovate existing or construct new buildings. Community Reinvestment Areas are areas of land in which property owners can receive tax incentives for investing in real property improvements.
- Ohio Data Center Tax Abatement provides a sales-tax exemption rate and term that allow for partial or full sales-tax exemption on the purchase of eligible data center equipment. Projects must meet minimum investment and payroll thresholds to be eligible.
- Ohio Enterprise Zone Program is an economic development tool administered by municipal and county governments that provides real and personal property tax exemptions to businesses making investments in Ohio. The Enterprise Zone Program can provide tax exemptions for a portion of the value of new real and personal property investment (when that personal property is still taxable) when the investment is made in conjunction with a project that includes job creation.
- Ohio Job Creation Tax Credit is a refundable and performance-based tax credit calculated as a percent of created payroll and applied toward the company’s commercial activity tax liability awarded to companies creating at least 10 jobs (within three years) with a minimum annual payroll of $660,000 and that pay at least 150 percent of the federal minimum wage and final approval from the Ohio Tax Credit Authority is required.
- Ohio Mega Site program is designed to attract large-scale industrial, headquarters, office, and research and development projects for high-wage jobs for projects at least $1 B in fixed asset investment and $75 M in payroll are eligible to receive double the term for local tax abatements and the Ohio JCTC.
- Ohio Municipal Job Creation Tax Credit provides an income tax credit tied to the provision of agreed-upon high-wage jobs and capital investment in various Ohio cities.
- Ohio Roadwork Development (629) funds are available for public roadway improvements, including engineering and design costs. Funds are available for projects primarily involving manufacturing, research and development, high technology, corporate headquarters, and distribution activity. Projects must typically create or retain jobs.
- Ohio Tax Increment Financing (TIF) is an economic development mechanism available to local governments in Ohio to finance public infrastructure improvements and, in certain circumstances, residential rehabilitation.
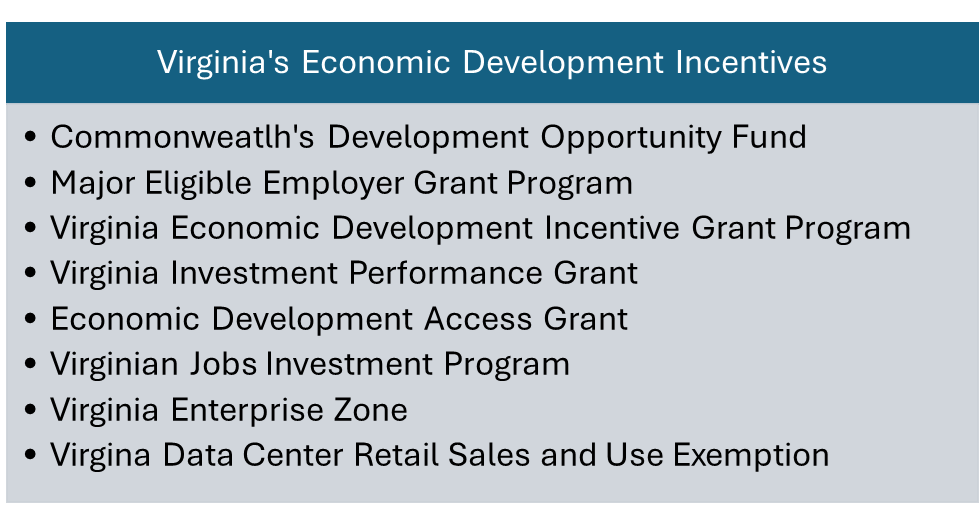
Virginia Economic Development Incentive Programs
The Commonwealth of Virginia offers a wide range of economic development incentives to companies considering a corporate site location project.
- Commonwealth’s Development Opportunity Fund (COF) is a “deal-closing” fund to be employed at the Governor’s discretion to secure a company location or expansion in Virginia. grant is awarded to the local government on behalf of the company. The local government is required to enter into a performance agreement with the company before it may receive the grant award.
- Major Eligible Employer Grant Program (MEE) is a discretionary program used to encourage major basic employers to invest in Virginia and to provide a significant number of stable employment opportunities by either making a significant expansion to existing operations or constructing new ones. The program offers cash grants of up to $25 million to qualified applicants for projects with a minimum capital investment threshold of $100 million, and creation of 1000 net new jobs.
- The Virginia Economic Development Incentive Grant program (VEDIG) assists and encourages companies to invest and create new employment opportunities by locating significant headquarters, administrative, or service sector operations in Virginia.
- The Virginia Investment Performance Grant (VIP) encourages continued capital investment by existing Virginia companies, resulting in added capacity, modernization, increased productivity, or the creation, development, and utilization of advanced technology for an existing Virginia manufacturer or research and development service that supports manufacturing, and the project must result in a capital investment of at least $25 million.
- The Economic Development Access (EDA) program is a state-funded incentive to assist localities in providing adequate road access to new and expanding manufacturing and processing companies, research and development facilities, distribution centers, regional service centers, corporate headquarters, and other basic employers with at least 51% of the company’s revenue generated from outside the Commonwealth.
- The Virginia Jobs Investment Program (VJIP) is a discretionary program that provides funding to companies creating new jobs or experiencing technological change to reduce the human resource development costs for new companies, expanding companies, and companies retraining their employees.
- The Virginia Enterprise Zone (VEZ) program is a partnership between state and local government that encourages job creation and private investment. VEZ accomplishes this by designating Enterprise Zones throughout the state and providing two grant-based incentives, the Job Creation Grant (JCG) and the Real Property Investment Grant (RPIG), to qualified investors and job creators within those zones, while the local government provides local incentives.
- Virginia Data Center Retail Sales and Use Tax Exemption (DCRSUT Exemption) offers qualifying computer equipment or enabling software purchased or leased for use in certain data centers in the Commonwealth meeting minimum investment and job creation requirements as outlined below.
Industrial Site Development Strategies Shift with Challenging Capital Markets
Rising interest rates have slowed the development of private sector speculative industrial space to a crawl. This presents an opportunity for communities to use an “old” tool to create public sector industrial parks to capture the manufacturing product that remains strong throughout the United States.
Industrial developers across the Country, and in particular Midwest markets (Chicago, Indianapolis, Kansas City, Columbus) have consumed large tracts of industrial land over the past 5-7 years. Across the 87 markets that make up CoStar’s National Index, there are 483 million SF of projects under construction, and vacancy rates have been rising for the last 5 quarters driving down rent growth across the country. The oversupply of speculative industrial buildings and increasing industrial vacancy rates is an opportunity for communities to form public-private partnerships to fill the gaps in attracting end users for FDI, food and beverage manufacturers, and Giga factories.
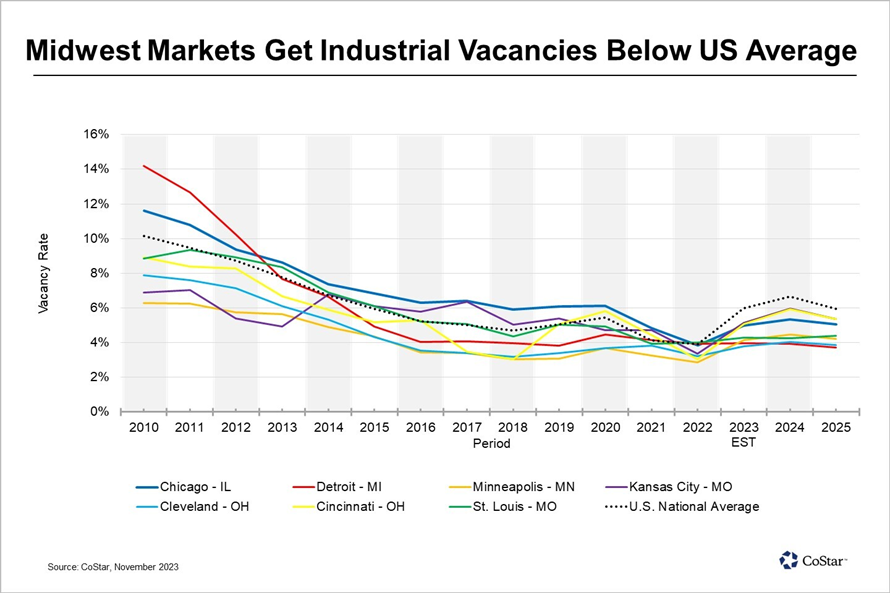
As illustrated by the Costar chart above, the Midwest market’s industrial vacancy rates are below the U.S. average illustrating there is an opportunity for growth based upon new investment. Including Chicago, seven of the 20 largest industrial inventories by square footage reporting vacancy rates below the national average are in the Midwest: Cleveland is at 3.6%, Minneapolis is at 3.8% and Detroit is at 3.8% vacancy.
Manufacturing construction starts are likely to continue to grow with the onshoring of production improving supply chains and significant new federal funding assisting those efforts according to the Dodge Construction Network Report. In 2024, Dodge anticipates that construction starts will again outperform most other sectors with a 16% increase in dollar value and a 10% gain in square footage. Since 2020, manufacturing construction starts have grown from 63 million square feet to more than 156 million square feet in 2023. Continued growth is expected in 2024.
| Montrose Group Industrial Site Development Strategy |
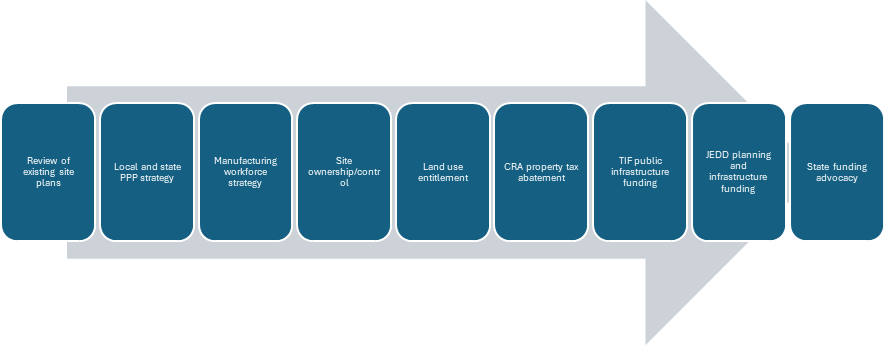
The Montrose Group suggests a thoughtful approach to create a public-private partnership (PPP) to support the development of public sector industrial parks that could lead to the creation of a small-scale or large, mega site for public sector entities.
Review of existing site plans. Review existing engineering plans, land use entitlements, and real estate plans and define the political jurisdictions related to the mega-site planning for the Cincinnati area to gain a further understanding of the steps needed to develop a public sector industrial park to outline the potential uses of local and state government funding.
Local and State PPP Strategy. Develop a local and state PPP strategy to prepare the public sector industrial site for global competition through appropriate real estate strategies, Community Improvement Corporation or other public entity ownership of the public sector industrial park, land use entitlements, property tax abatement, TIF, and state funding.
Manufacturing Workforce Strategy. Tight manufacturing labor markets demand communities prepare a workforce strategy for this industry before the company even comes to town. Partnerships with local educational institutions and local companies is the place to start and retention of young workers is the number one priority.
Site Ownership/Control. Gain the necessary site development organization that may need to be formed by the public entities tied to the public sector industrial park.
Utility Negotiations. Gain the needed utility infrastructure to prepare the site for global competition.
Land Use Entitlements. Negotiate and adopt the needed annexation, zoning, or other land use entitlements for the public sector industrial park.
CRA Property Tax Abatement. Negotiate and adopt the appropriate Ohio tax abatement program, term, and amount that the site needs to be globally competitive and support the negotiations of local school compensation agreements if required.
TIF Public Infrastructure Funding. Negotiate and adopt the appropriate public infrastructure programs like tax increment financing to fund the infrastructure needed to make the site globally competitive and support the negotiations of local school compensation agreements if required.
JEDD Planning and Infrastructure Funding. Create a working partnership between a county, township, and city if needed if the state permits the use of Joint Economic Development Districts or other tools to provide joint economic and public service planning between relevant cities and townships to provide needed infrastructure funding.
State Funding Advocacy. Identify potential sources and uses of funding for the development of the public sector industrial park that include the programs outlined above, support the creation of the funding applications, and advocate for their adoption.
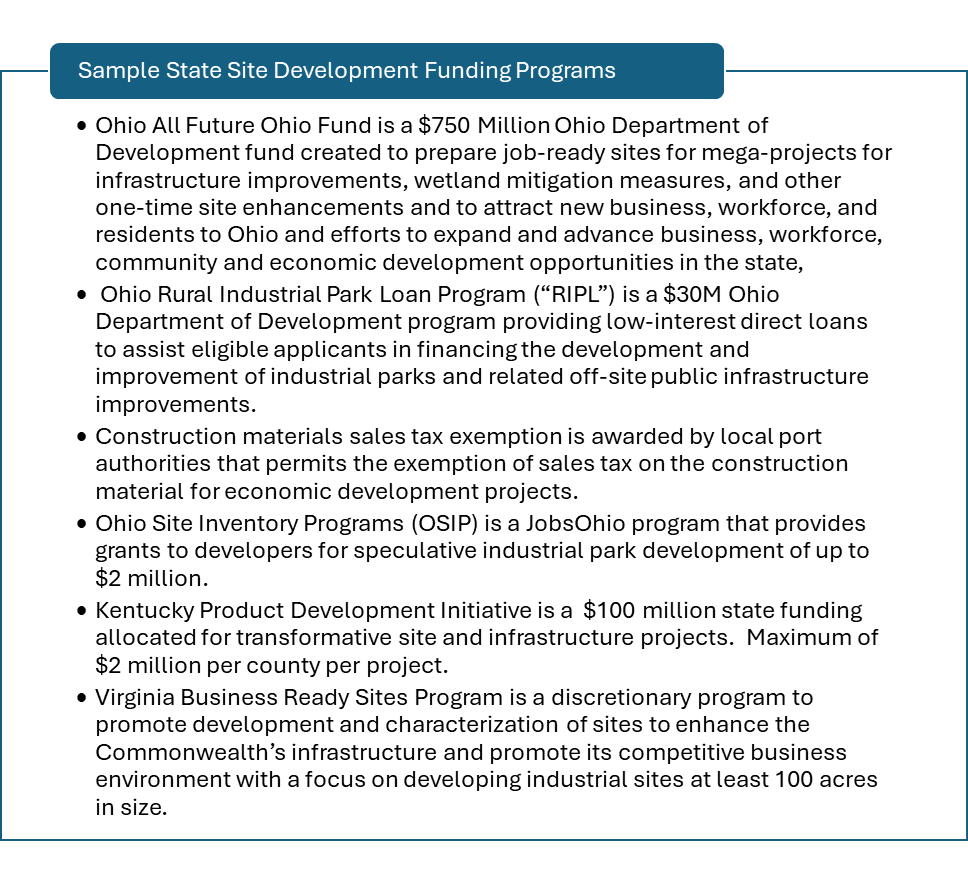
State economic development programs exist across the United States to prepare industrial sites for development.
Defining the Office Vacancy Rate Challenge
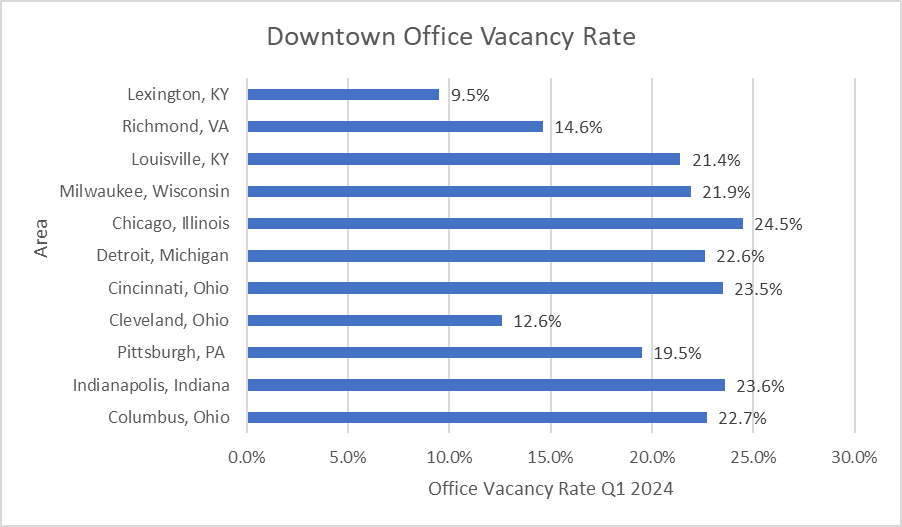
Corporate site location projects are simply not full of a large number of office jobs as Work From Home (WFH) has shifted the footprint of many corporate site location projects. The urban and suburban office market is facing a crisis that is only going to get worse. The Downtown office vacancy rates from Cushman and Wakefield’s 2023 analysis as outlined in the chart below in the major urban markets as outlined below illustrates substantial struggles with the current Downtown office markets. This data is of more concern when looking at the number of tenants attempting to sublease their current space—which is very high across the United States. It is clear the U.S. Downtown office market is not in good shape and is going to get worse as many companies will not renew Downtown office leases and seek much smaller spaces.
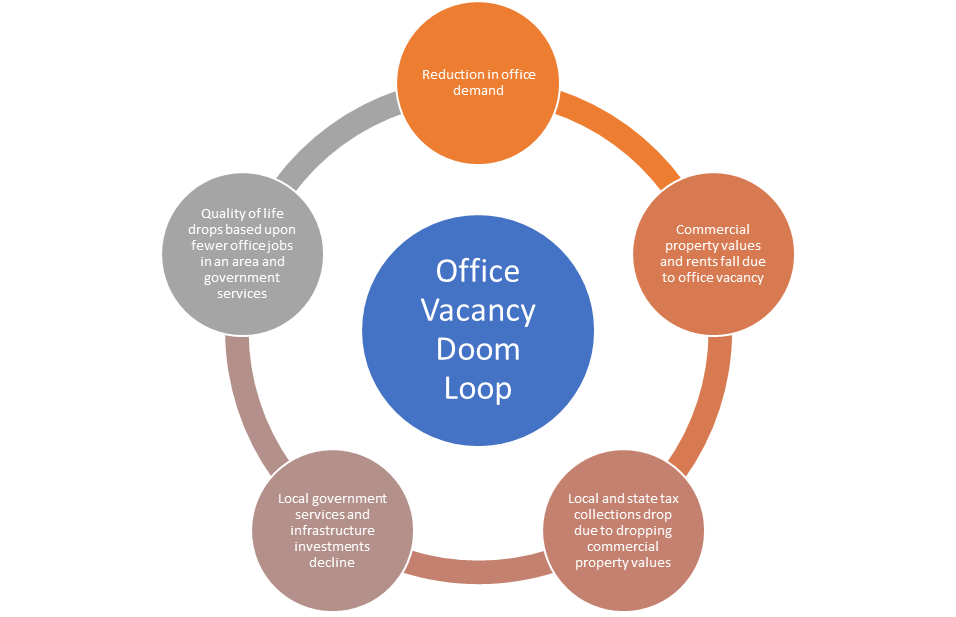
This high office vacancy rate could trigger a “Doom Loop” in urban and suburban Central Business District and suburban office parks respectively. A “Doom Loop” is a downward economic spiral triggered by remote work, which makes office towers less valuable and results in reduced city tax revenues which begins a domino effect in which workers who no longer need to live in a city leave for cheaper housing, causing retail businesses to shutter and city services such as police and utilities are reduced by the cash-strapped municipality, causing even more residents to leave the downtown core.
High office vacancy rates impact corporate site location projects that are heavy office users like advanced services, corporate headquarters, and professional service firms as these projects are not producing jobs in an office that are critical for the collection of local and state economic development incentives. Local and state government economic development incentives are driven by a Return on Investment (ROI) analysis that determines if a company will create more taxes than they take from economic development incentives.
AI is going to impact the U.S. office market as well. AI is going to be the next great disruption of the global economy. Just as automation disrupts the global manufacturing industry, AI is going to disrupt the advanced services or white-collar industries. A Pew Research study found that workers with a bachelor’s degree or more (27%) are more than twice as likely as those with a high school diploma only (12%) to see the most exposure. Jobs are considered more exposed to artificial intelligence if AI can either perform their most important activities entirely or help with them. AI could well replace the tasks of “getting information” and “analyzing data or information,” or it could help with “working with computers.” These are also among the key tasks for lawyers, software engineers, accountants, customer service representatives, and other white-collar workers—all these occupations currently fill many global offices. AI will likely create more jobs than it eliminates but in the near term, AI will hurt urban office markets.
On a positive note, while today’s urban and suburban office markets are struggling, they are primed for redevelopment into new and higher uses.
Transforming the Office Vacancy Doom Loop in Bloom
While there is plenty of doom about the current office market there is lots of opportunity for bloom. The current decline of urban and suburban office markets gives cities the ability to redevelop new neighborhoods and bring residents and new businesses into their markets.

Any office redevelopment strategy needs to develop action steps focused on answering the challenges and capturing the opportunities in the market. Often, challenges center on gaining financing for reusing struggling office towers, developing connected parking for targeted struggling buildings, addressing the general lack of green space in many urban centers, redoing the car-centered design for Downtowns, and addressing the lack of connectivity for many Downtown districts with each other. Opportunities that exist for the Downtown Columbus office market include the demand for housing in the region and potential new uses for existing office space.
High interest rates driven by efforts of the Federal Reserve Bank, plus questions about the viability of urban and suburban office uses, have created a financing crisis for the redevelopment of many office towers across the United States. Construction costs have not abated when it comes to redeveloping an aging office building—with construction costs near $300 a square foot in even mid-sized urban markets for converting office space into a residential product.
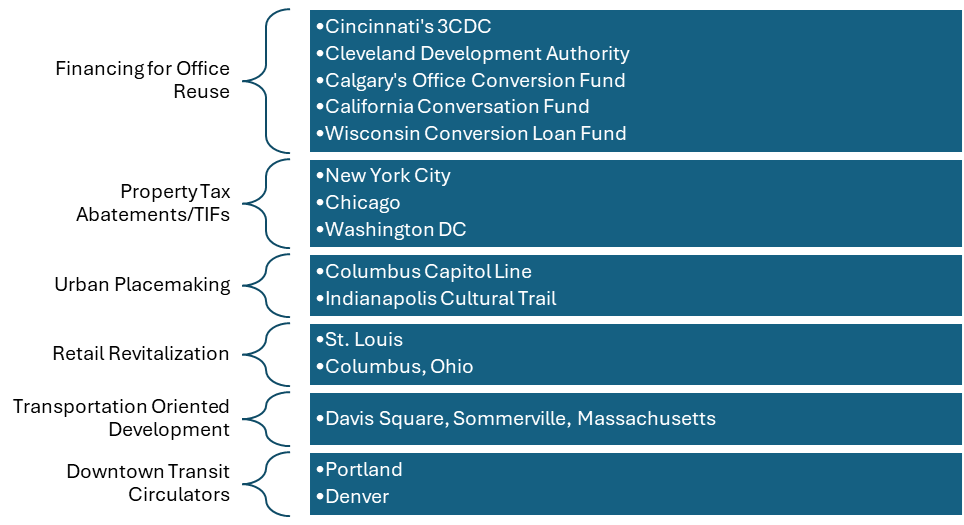
The success of Cleveland’s Downtown office redevelopment was driven in large part by the creation of a mezzanine loan fund to support office conversion for vacant Downtown buildings. However, Cleveland’s Downtown rebirth was made easier because they had a large stock of pre-war and mid-century buildings easier from a structural sense to convert into housing and eligible for the state and federal historic preservation tax credit. Cincinnati’s 3CDC has gained $200 M in private investment from area companies to promote the redevelopment of their Downtown and Over the Rhine neighborhood. Announced in August 2021, Calgary’s downtown development incentive program provides grants for office conversation projects with an initial investment of $45 million and offers $75 per square foot for residential conversions, up to a maximum of $10 million. An additional $108 million has been committed to the program since then and the city says there are 17 projects in the works. Calgary is not alone in its efforts to create or modify existing government programs to support the conversion of struggling office space.
• In 1995, New York City created a property tax abatement, known as 421-g, to encourage office-to-residential conversions in the Lower Manhattan area, and, by 2006, 13% of Lower Manhattan’s office space had been converted to residential, which resulted in nearly 13,000 new housing units.
• The City of Chicago proposals for conversion projects for LaSalle Street in downtown Chicago and recently announced five projects that were selected that will create more than 1,600 new residential units, approximately 600 of which will be reserved for households with incomes that are 60% of the area median income through the use of the city’s TIF program and grants for ground-level businesses that will be needed to support residents, such as grocery stores.
• Washington DC introduced the Housing in Downtown (HID) Abatement to encourage conversions of underutilized office space, and the program will provide a 20-year property tax break to developers converting commercial spaces to residential space.
• In California, lawmakers have approved $400 million in incentives for commercial-to-residential conversions, including $105 million in grants to fund the conversion of commercial space into affordable and market-rate housing.
• Wisconsin created a loan fund to help developers cover the costs of converting vacant commercial buildings to affordable or senior housing by providing interest-free loans of up to $1 million, and any new housing created using these loans will be required to be maintained as affordable or senior housing for at least 10 years.
Finally, Congress is considering several bills that would support the conversion of office space to more productive uses. Congressman Mike Carey (R-OH-15) and a bi-partisan group of Senators and House members introduced legislation known as the Workforce Housing Tax Credit that creates a tax credit to facilitate the conversion of older, underutilized commercial properties into affordable housing. According to a summary provided by the U.S. Senate Finance Committee, the Workforce Housing Tax Credit would be:
- Awarded by the state housing finance agencies and allocated to developers through a competitive process.
- provided to developers over a 15-year period, with a 15-year compliance period and 30-year extended commitment.
- allocated to states based on population, and, for 2024, the allocation would be $1 per capita with a $1.5 million small state minimum, and an additional 5% of the allocation is made available and reserved for middle-income housing developed in rural areas.
- Equal to 50% of the cost of a new building over the lifetime of the credit, and, for rehabilitated buildings and bond-financed buildings, the credit would equal 20% of the cost of the building.
- Used only if at least 60% of the building’s units must be occupied by individuals with area median incomes of 100% or less where the rents are restricted to 30% of the designated income.
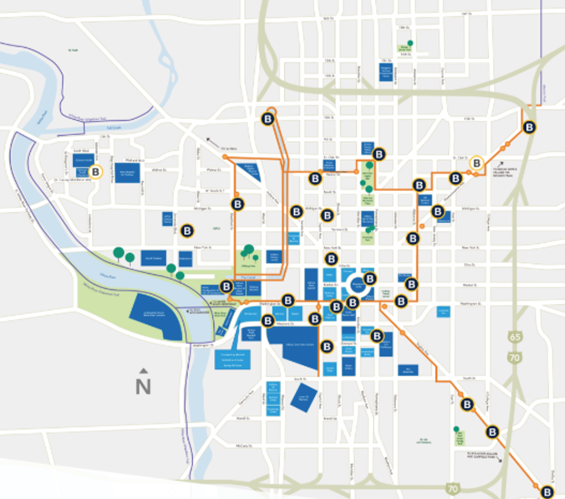
Urban parks and green space create substantial economic benefits for the region in which they are near. Public space investments, like the Cultural Trail in Downtown Indianapolis, build a walking trail that connects Downtown districts and spurred economic investments along the trail while creating a walkable city center. Columbus, Ohio is planning a similar trail to be known as the Capitol Line to connect their Downtown districts.
Indianapolis Cultural Trail
The development of retail establishments is a critical amenity needed to support the redevelopment of office buildings. According to the International Downtown Association, due to their higher density and expansive user base, downtowns support a vibrant variety of retail, infrastructure, and institutional uses which offer mutually reinforcing benefits to the region.
Many cities are recognizing the importance of Downtown retail as a critical amenity for office workers, residents, and tourists. St. Louis launched a program driven by COVID-19 that provides:
- Downtown Pop-Ups. Designed to activate pop-up retail shops in vacant storefronts. Offers up to $15,000 per storefront.
- Inside-Out Sidewalk Café Program. Will help Downtown restaurants build aesthetically pleasing outdoor seating or retail displays to encourage more activity at street level. Restaurants can receive up to $5,000 per storefront.
- Tenant Improvements. Assists new retail establishments with grants of up to $50,000 for interior and exterior tenant improvements, such as new flooring, lighting, windows, as well as historical restoration.
- Rent Guarantees. Supports property owners with a rent “backstop” to mitigate their risk and empower them to lease more space to retail establishments.
Following a successful pilot in 2022, the popular Downtown Columbus, Ohio LunchBucks program was expanded in 2023 to the benefit of downtown’s restaurant scene. Led by the Downtown Columbus, Inc. (DCI), the program provided free vouchers to office workers, residents, and visitors who patronize downtown restaurants. LunchBucks saw 42 participating restaurants receive a total of $110,000 in 2023. The City of Columbus and DCI also recently launched the Downtown Ground Floor Growth Initiative. The Downtown Ground Floor Growth Initiative program is designed to support small minority- and/or woman-owned businesses located in Downtown Columbus. This program will provide rental support for three years (50% for the first year, 30% for the second year, 10% for the third year) and tenant improvement funds, not to exceed $40/sq ft.
Many communities have used transit investments to promote their Downtowns. Davis Square, in Somerville, Massachusetts, and the Green Line in Chicago illustrate the impact that new and renovated subway stations can have on the development of entire downtown revitalization programs. In addition to transit stations, some cities have experimented with transit malls, that is, streets transformed to give priority access to buses and enhanced waiting areas for bus patrons in communities like Portland and Denver. Downtown circulators and shuttles are other strategies used to enable shoppers, visitors, and office workers to move more freely about the central business district, thereby contributing to downtown economic vitality and reducing traffic congestion. These circulators and shuttles are often sponsored by local chambers of commerce, downtown business organizations, and merchant associations as a promotional program, and some cities have created a trolley service link redeveloping urban areas with tourist attractions such as sports stadiums, convention halls, restaurant districts, shopping centers, and bus terminals–Tucson’s Old Pueblo Trolley and Corpus Christi’s trolleys.
Another transit approach supporting Downtown development is the use of Transit Oriented Developments (TOD). TOD is a planning approach that calls for high-density, mixed-use business/neighborhood centers to be clustered around transit stations and corridors. TOD is considered a “smart growth” strategy because it tackles the issue of where growth should occur from a regional “sustainability” perspective; and it coordinates land use and transportation, such that both land and infrastructure are used efficiently.
Answering the Doom Loop challenge requires a multifaceted action plan addressing a wide range of approaches, and, what appears to be a daunting challenge, is likely the biggest economic development opportunity in decades.
Housing is a Major Corporate Site Location Challenge
The development of housing is a solution to the U.S. workforce development crisis and has a major impact on a company’s decision about where to retain or attract high-wage jobs and to make a capital investment. Whether a region is growing or not, without the availability of housing that a company’s workforce can afford, companies struggle to expand or locate in that region.
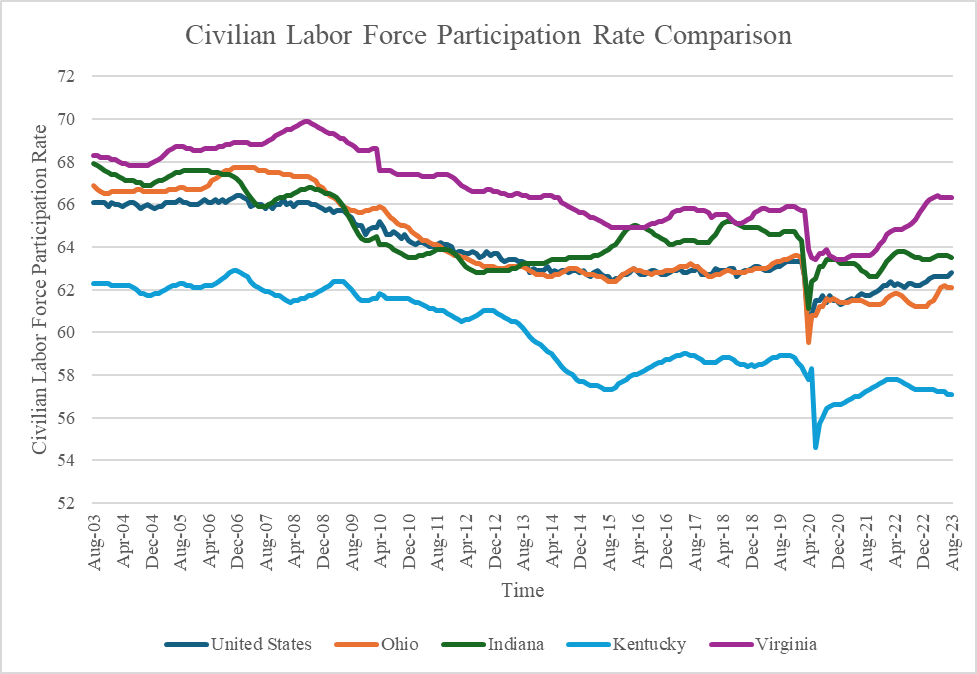
Workforce remains a major corporate site location factor driven by demographic changes and the long-term impact of COVID-19. Five million Americans have simply left the workforce since COVID-19. The U.S. Civilian Labor Participation rate is 1.5 points lower than prior to when COVID-19 began to impact the economy in February of 2020. Ohio’s labor participation rate has been consistently below the nation and neighbors such as Indiana as illustrated by the table below.
Record-high job openings, turnover, and low unemployment have sent companies scrambling to find creative attraction and retention strategies, and housing has become one of them. After the Great Recession, new home construction dropped like a stone. Fewer new homes were built in the 10 years that ended in 2018 than in any decade since the 1960s. By 2019, a good estimate of the shortage of housing units for sale or rent was 3.8 million. The pandemic-induced materials and labor shortage exacerbated the trend, however, as evidenced by the surge in rents and home prices in 2021. Retaining and recruiting workers is a top corporate site location strategy—communities big and small have found they cannot gain the workers they need if the workers cannot have access to housing they can afford.
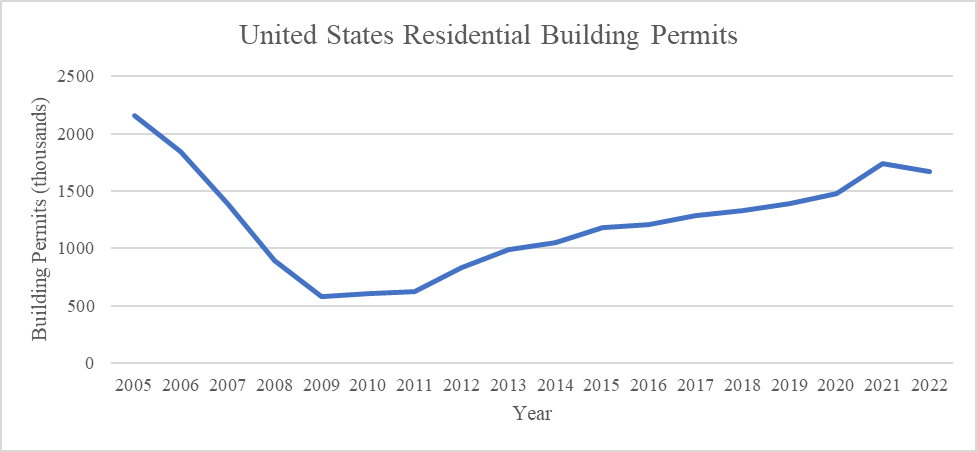
The increase in residential development within an area can almost directly correlate to an increase in jobs, income, and economic development in general. As jobs and businesses are created and relocated within growing areas, the housing stock necessary to support those businesses seems to follow in tandem. Residential building permits throughout the United States have been steadily increasing since hitting a low of 582,000 permits in 2009. Although, even with the level of residential building permits increasing for the previous decade there is still a chronic shortage of reasonably priced homes throughout the United States. Despite decades of policy and program intervention at federal, state, and local levels, this issue has persisted without significant mitigation. As a result, there is a disconcerting number of individuals who allocate more than 30% of their income towards housing expenses, falling under the category of housing cost burden.
Housing and corporate site location have become connected as housing costs have risen substantially making it difficult for a company to find locations where their workers can afford to live. Housing affordability, or the ability of individuals and families to access and afford suitable housing, is a critical issue that has widespread impact throughout an area. In 2020, the percentage of households experiencing housing cost burdens at the national level reached 30 percent, with more than 30 percent of their income dedicated to housing expenses. Furthermore, a substantial 14 percent of all households found themselves in severe financial distress, as they allocated over half of their incomes toward covering their housing costs. [iii]
The change in median listing prices for residential units in Ohio’s metropolitan statistical areas (MSA) has undergone significant increases over the past seven years. The largest increase was felt in the Dayton MSA market, which increased by 104% from 2016 to 2023. Following the Dayton MSA was the Cincinnati MSA, 97%, the Columbus MSA, 80.5%, the Toledo MSA, 58.8%, and the Cleveland MSA, 52.8%. Overall, every single measured metropolitan statistical area in Ohio experienced a significant increase in the unaffordability of residential units. The area with the largest increase in unaffordability was the Toledo MSA with an increase of 55.7% in their price-to-income ratio, due to having the smallest increase in median household income from 2016 to 2023. The Columbus MSA experienced an increase of 44.3%, followed by the Dayton MSA at 39.8%, the Cincinnati MSA at 29.8%, and the Cleveland MSA at 24.2%.
| Ohio MSA Housing Affordability | |||
| Area | Median Listing Price Change (2016 – 2023) | Median Income Change (2016 – 2023) | Price to Income Ratio (2023) |
| Columbus MSA | 80.5% | 25.2% | $5.05 |
| Cincinnati MSA | 97.0% | 24.3% | $4.07 |
| Cleveland MSA | 52.8% | 23.0% | $3.52 |
| Dayton MSA | 104.0% | 22.8% | $3.72 |
| Toledo MSA | 58.8% | 21.2% | $3.67 |
| Austin MSA | 43.0% | 33.2% | $5.91 |
| Indianapolis MSA | 82.9% | 33.6% | $4.32 |
| Charlotte MSA | 35.2% | 28.6% | $5.45 |
| Nashville MSA | 70.8% | 33.3% | $7.01 |
| Louisville MSA | 46.3% | 32.6% | $4.49 |
| Richmond MSA | 51.9% | 33.2% | $5.23 |
| Lexington MSA | 50.1% | 27.0% | $6.06 |
| Source: U.S. Census Bureau, Realtor.com | |||
The availability of affordable housing has become a major corporate site location factor for many parts of the United States.
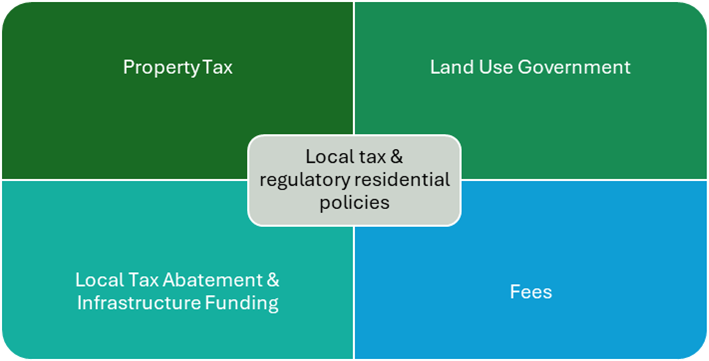
Local and State Tax and Regulatory Policy Impacts the Availability of Affordable Housing
Taxes, fees, land use policy, funding of infrastructure, and other regulations impact the growth of residential development. While labor wage rates and the cost of real estate are major factors impacting the cost and availability of residential development, the government generally cannot control those costs. Instead, how residents are taxed and how residential development is regulated are two factors local and state governments do control that can impact new residential development.
Property taxes have a large impact on residential development. Property taxes, or real estate taxes, are paid by a real estate owner to county or local tax authorities. The amount is based on the assessed value of your home and varies depending on your state’s property tax rate. According to a 2022 Council on State Taxation report, taxes on both real and personal property are the largest source of state and local tax revenue. In general, property taxes are increasing nationwide, doubling in some markets between 2021 and 2022, according to a recent study from ATTOM Data Solutions, a real estate research firm. The average tax amount on single-family homes nationwide jumped by 3% in 2022, averaging $3,901 annually.
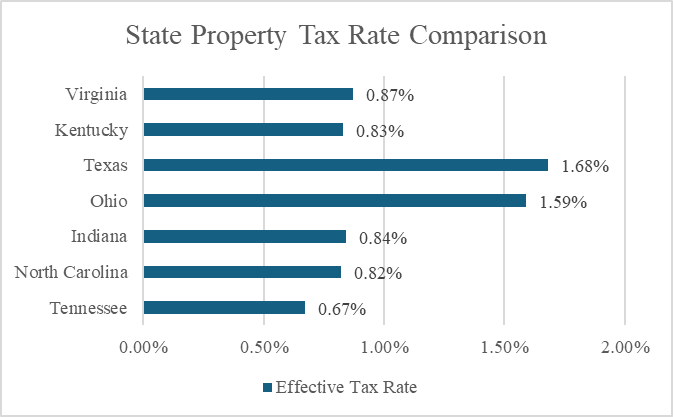
Ohio has a property tax rate that is about double the rates of competitors in Indiana, North Carolina, and Tennessee as illustrated by the chart above. Texas has a higher property tax rate, but the state and cities do not use an income tax which increases the rates of other taxes such as the property tax to pay for essential local and state government services.
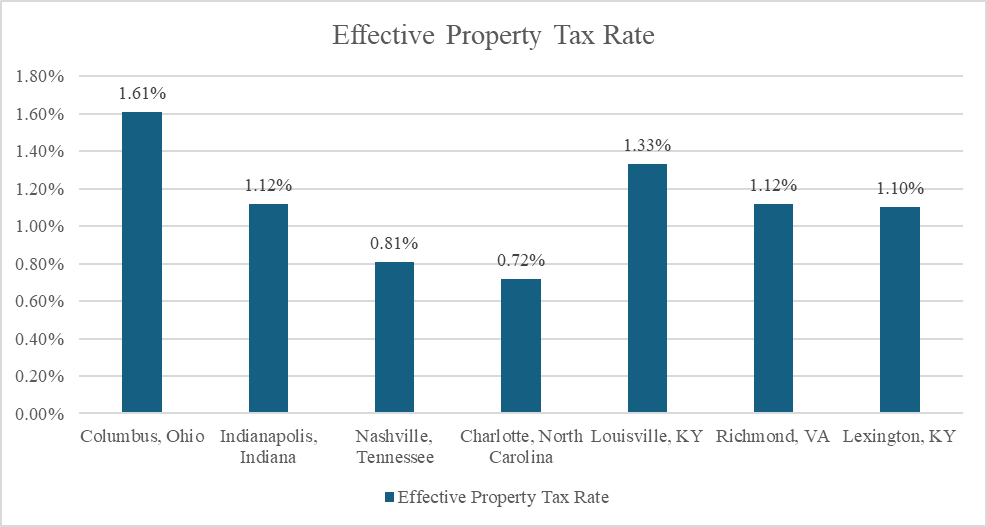
A critical determinant of property tax rate disparities is home values. Cities with higher property values have the flexibility to impose lower tax rates while still generating comparable property tax revenue to cities with lower property values. Lower property taxes can encourage real estate investors and developers to allocate more resources to residential projects. This can lead to the construction of new housing developments or the renovation of existing properties, which can benefit both the local housing market and the economy. The data in the figure below provides information about property taxes for owner-occupied primary residences in the comparable cities, focusing on homes with median values. The effective tax rate bill paid by Columbus residents ranks 12th out of the 50 cities measured below, placing their tax bill higher than many benchmark cities like Charlotte, North Carolina (45th), Indianapolis, Indiana (33rd), and Nashville, Tennessee (41st) according to the Lincoln Institute of Land Policy.
No matter the measure, Ohio’s property tax rates are higher than most economic competitors in the United States. Of greater concern is the current rise is the current rise in property tax rates. In Franklin County, assessed values (which determine property taxes) will likely increase by 30% to 40% in January 2024, Butler Country expects to see increases reach 42%, Clermont County could hit 43%, according to data from the Ohio Department of Taxation while Athens was pegged at 20%, and Summit County residents could see their values rise by 34%.[iv]
Property tax abatements for residential development are a tool Ohio has to address high property taxes. Community Reinvestment Area Tax Abatements permit local governments to provide property tax abatements on new investments up to 100% through the Community Reinvestment Area (CRA) program that does not require local school board approval for districts created before 1994. The Ohio CRA program is an economic development tool administered by municipal and county governments that provides real property tax exemptions for property owners who renovate existing or construct new buildings. CRAs are areas of land in which property owners can receive tax incentives for investing in real property improvements.
Land use government generally implements through zoning regulation and is used by local governments to control and dictate the use of land, including how housing is developed and utilized within their jurisdictions. In U.S. cities, approximately 75% of the land is zoned exclusively for detached single-family homes, while in areas where multifamily buildings are permitted, stringent height and lot size regulations can adversely impact the economic feasibility of development. [v]
Local governments manage design, growth, and development typically through a comprehensive plan that can serve as a legally binding document that sets the overall goals, objectives, and policies to guide the local legislative body’s decision-making regarding the development of a region or community. However, how a local government manages this land use regulation can be a major challenge to developing residential projects.
| Ohio Township Zoning Process |
Ohio permits townships to implement a lengthy and, at times, confrontational zoning process. Ohio requires the creation of a rural township zoning commission that acts as an advisory body to recommend changes to a township zoning code. Twenty-two states do not even have townships and states like Indiana permit adjoining cities to plan and zone for connected townships. The township zoning commission holds public meetings to make recommendations to the Township Trustees regarding potential changes to the township zoning code.
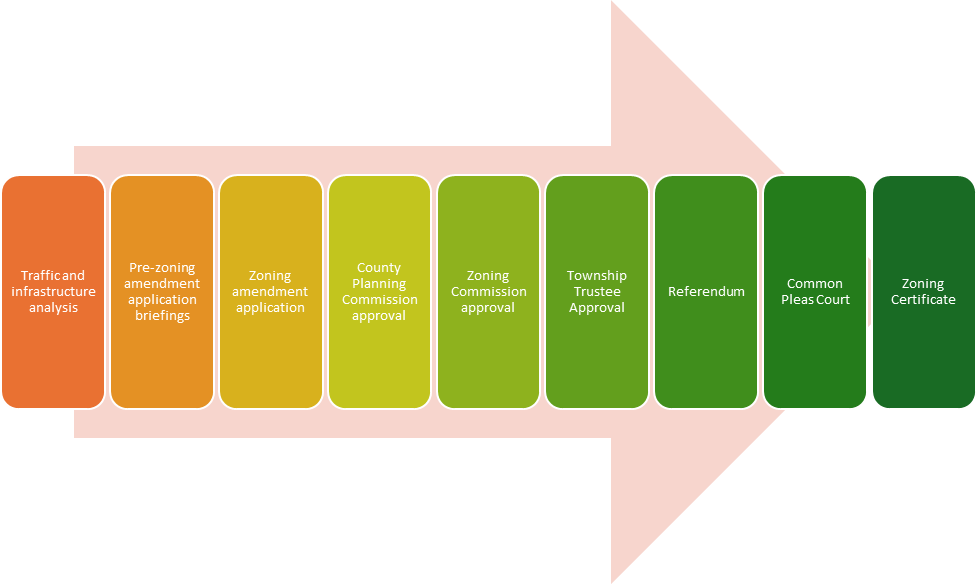
Township Trustees vote to support a zoning change, then the township zoning amendments are subject to voter referendum if 15% of the township voters’ signatures are gathered in the last Governor’s election on a valid petition within 30 days. Finally, the zoning ordinance is set if no referendum is filed or is defeated by the voters.
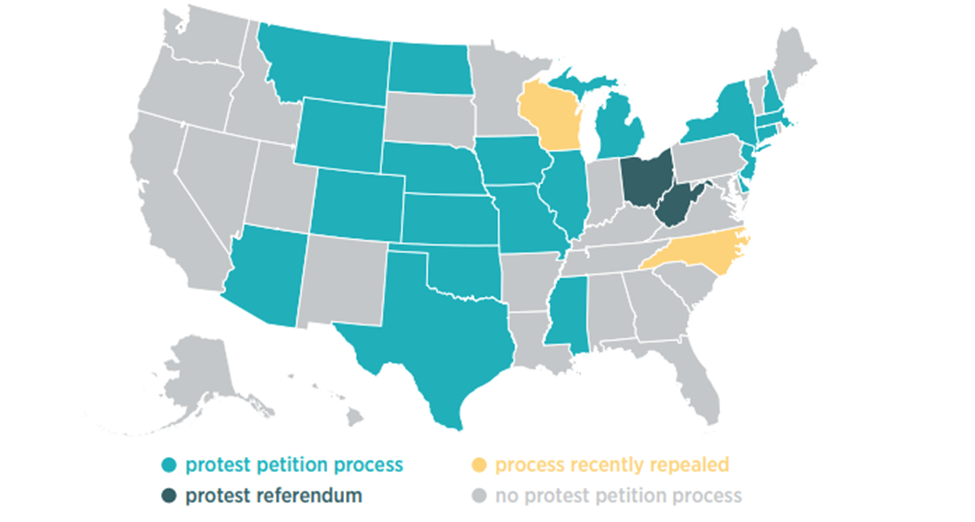
As the map below illustrates, Ohio is only one of two states that even permits zoning decisions by an elected body to be overturned by a vote of the people through a referendum. According to the Mercatus Center at George Mason University, twenty states currently have state protest petition laws, and each state sets its own definition of “nearby” property owners and its own threshold for what percentage of nearby private property must be owned by petitioners in order to make the protest petition valid.
Protest Petitions by Law By State
Local and state regulation and taxing of residential development has a major impact on the growth and investment for housing across the United States.
[i] https://www.ibrc.indiana.edu/ibr/2015/spring/article2.html
[ii] Ibid.
[iii] https://www.census.gov/library/stories/2022/12/housing-costs-burden.html
[iv] https://www.cincinnati.com/story/news/politics/2023/05/24/historic-increase-ohio-property-taxes/70249669007/
[v] https://www.brookings.edu/articles/to-improve-housing-affordability-we-need-better-alignment-of-zoning-taxes-and-subsidies/