The retirement of the Baby Boom generation and the reduction of the Civilian Labor Participation Rate triggered by Covid 19 created a skilled workforce crisis throughout the United States. In many regions, there are more open jobs than there are unemployed people.
Understanding workforce industry strengths is another critical method to measuring a region’s workforce development strengths. This measurement is best done through the use of an industry cluster analysis. Industry clusters are regional concentrations of related industries.[i] Clusters consist of companies, suppliers, and service providers, as well as government agencies and other institutions that provide education, information, research, and technical support to a regional economy.[ii] Clusters are a network of economic relationships that create a competitive advantage for the related firms in a particular region, and this advantage then becomes an enticement for similar industries and suppliers to those industries to develop or relocate to a region.[iii] Clusters exist in all types of economies and are more prevalent in locations that achieve better performance relative to their overall stage of development.[iv] It is useful to view economies through the lens of clusters rather than specific types of companies, industries, or sectors because clusters capture the important linkages and potential spillovers of technology, skills, and information that cut across firms and industries.[v] Viewing a group of companies and institutions as a cluster highlights opportunities for coordination and mutual improvement. A Location quotient is an indicator of the economic concentration of a certain industry in a state, region, county, or city compared to a base economy, such as a state or nation that measures industry clusters in a region. A location quotient greater than 1 indicates the concentration of that industry in the area. A location quotient greater than 1 typically indicates an industry that is export-oriented. An industry with a location quotient of 1 with a high number of jobs present is likely a big exporter and is bringing economic value to the community feeding the retail trade and food services sectors.
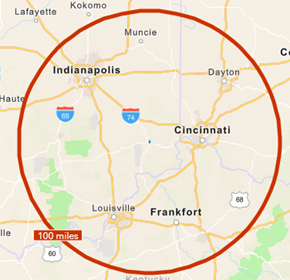
The Cincinnati, OH-KY-IN Metro Area is located less than 100 miles from the Indianapolis-Carmel-Anderson, IN Metro Area and the
Louisville/Jefferson County, KY-IN Metro Area. While these three major metropolitan statistical areas are all located within a 100-mile radius of one another, the leading industry sectors within these areas provide a variety of similarities and differences. The Cincinnati Metropolitan Statistical Area manufacturing sector had an annual average employment of 114,388 in the year 2021. This manufacturing employment in the Cincinnati area is greater than the annual average employment in the manufacturing sectors of Indianapolis and Louisville. There are only three similar NAICS sub-sector industries within each of the three metropolitan statistical areas: transportation equipment manufacturing, beverage and tobacco product manufacturing, and couriers and messengers as illustrated by the table below. While six of the top ten industry sub-sectors within the Cincinnati, OH-KY While six of the top ten industry sub-sectors within the Cincinnati, OH-KY-IN Metro Area are manufacturing-related, Indianapolis and Louisville’s top ten industries only contain four. Cincinnati has built a strong locality of manufacturing industries compared to many of the surrounding major cities. With manufacturing-related industries beginning to shift back to the United States from overseas, regions like Cincinnati with a proven track record of success, and strong employment numbers in this industry are poised to capitalize and grow.
Regional Location Quotient Comparison
| Cincinnati MSA | Indianapolis MSA | Louisville MSA | |||
| NAICS Sub-Sector | Location Quotient Score | NAICS Sub-Sector | Location Quotient Score | NAICS Sub-Sector | Location Quotient Score |
| Chemical manufacturing | 2.9 | Chemical manufacturing | 5.03 | Couriers and messengers | 9.15 |
| Primary metal manufacturing | 2.53 | Warehousing and storage | 3.29 | Beverage and tobacco product manufacturing | 5.26 |
| Management of companies and enterprises | 2.44 | Postal service | 2.81 | Warehousing and storage | 2.9 |
| Paper manufacturing | 2.29 | Couriers and messengers | 2.23 | Printing and related support activities | 2.62 |
| Transportation equipment manufacturing | 2.12 | Printing and related support activities | 1.93 | Insurance carriers and related activities | 2.56 |
| Museums, historical sites, and similar institutions | 2.09 | Performing arts, spectator sports, and related industries | 1.78 | Transportation equipment manufacturing | 2.5 |
| Support activities for transportation | 2.04 | Fabricated metal product manufacturing | 1.43 | Wood product manufacturing | 1.59 |
| Textile mills | 1.95 | Beverage and tobacco product manufacturing | 1.36 | Truck transportation | 1.58 |
| Beverage and tobacco product manufacturing | 1.78 | Transportation equipment manufacturing | 1.36 | Primary metal manufacturing | 1.56 |
| Couriers and messengers | 1.76 | Ambulatory health care services | 1.36 | Miscellaneous store retailers | 1.55 |
A wage rate comparison for these industries with a high concentration of jobs in the Cincinnati, Indianapolis, and Louisville markets illustrates a relatively competitive wage rate compared to each other.
[i] https://www.ibrc.indiana.edu/ibr/2015/spring/article2.html
[ii] Ibid.
[iii] Ibid.
[iv] https://clustermapping.us/content/clusters-101
[v] Ibid.