The battle against COVID 19 is likely not even at halftime yet but it is not too early to explore how states across the United States are doing in battling COVID 19 and understanding how this virus is impacting different state economies differently. First, preserving public health is everyone’s goal and measuring the economic impact of COVID 19 must start with how is a state doing in combatting the illness. The Montrose Group reviewed data from public health, state and federal government sources to provide some insight on how the states are doing against COVID 19.
The Center for Disease Control (CDC) data from May 8, 2020, illustrates how COVID 19 is hitting the states across the U.S. First of all, COVID 19 is everywhere in the United States with all fifty states having cases. Sadly, the United States has more COVID 19 cases than anywhere else on the globe. Based upon CDC data measuring the number of cases per 100,000 residents, the states of Hawaii, Montana, Alaska, Oregon, West Virginia, Maine, Oklahoma, Wyoming, Arkansas and Texas have the lowest number of COVID 19 cases per 100,000 residents. Unfortunately, as the table below illustrates, the states with the largest number of COVID 19 cases per 100,000 residents includes: New York, New Jersey, Massachusetts, Rhode Island, Connecticut, District of Columbia, Michigan, Louisiana, Delaware, Illinois and Maryland.
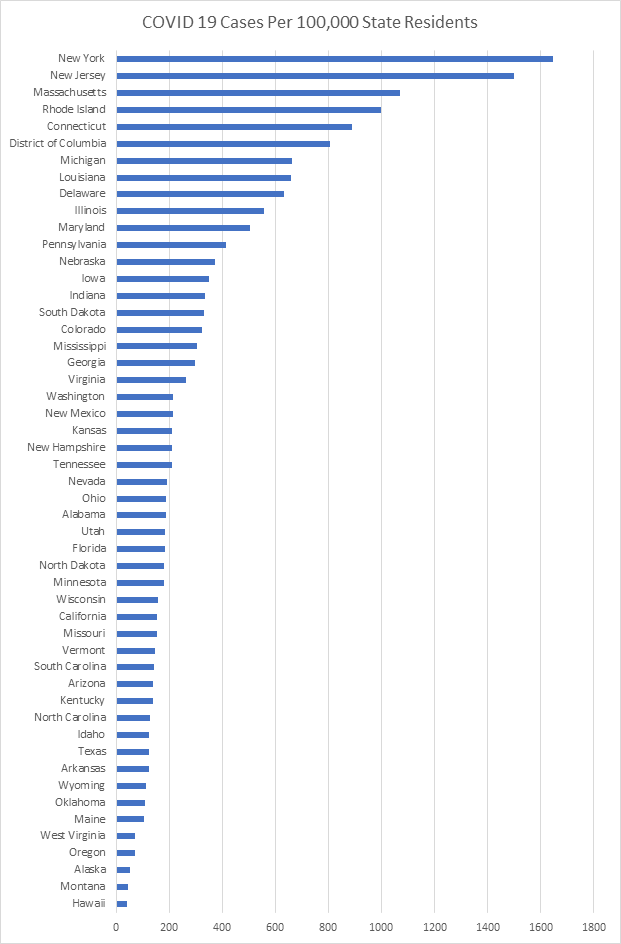
Why are these states struggling more than others in the fight against COVID 19. All these states were relatively early adopters in the global public health strategy of “social distancing” being the key to reducing infections. The most aggressive “social distancing” tactic has been ordering as many workers as possible to work from home. In fact, 45 states have ordered some from of Work From Home order. Of the ten states with the highest COVID 19 infection rates, all but the District of Columbia moved before April, 2020 to order Work From Home, and the District of Columbia implemented this order on April 1. Population density maybe the larger challenge for these states. The East Coast dominated list of states with the largest rates of COVID 19 all are also very high on the list of states with the highest population density or have cities like New York City with densely population neighborhoods. As an example, New York City has the highest population density of any city in the U.S. with 28,211 residents per mile. Los Angeles, America’s second largest city, has a population density three times smaller than New York City. California has 153 residents per 100,000 infected with COVID 19 while there third cousin New York 1647 residents per 100,000 infected, and California is the 18th least infected state while New York is the top infected state in the U.S.. Who would have ever thought urban sprawl would be an asset?
Measuring economic performance by state is challenging as the data is not moving as quickly as the infection and health policies taken to combat the virus. From a national level, the impact of COVID 19 on the economy is devasting:
- US GDP fell 4.8% and Personal Consumption Spending fell 7.6% in Q1 2020;
- Federal Reserve found manufacturing output decreased 6.3% in March from the prior month;
- US restaurants report in March laying off 3 M workers & losing sales of $25 B; and
- Retail sales plunged 8.7% in March
- Car sales dropped 25.6 %
- Clothing sales fell 50.5 %
- Grocery sales increased 26%
- Non-store retail increased 3.1%.
Measuring the impact of COVID 19 at the state level right now is best done by reviewing state unemployment rates. Federal data on state gross domestic product, personal income and other measures is not available yet. Unemployment rates by state are readily available and provide the best early snapshot of the economic impact of COVID 19. Nationally, the advance seasonally adjusted insured unemployment rate was 15.5 percent for the week ending April 25, an increase of 3.1 percentage points from the previous week’s unrevised rate. According to recent U.S. Labor Department data, the states with the lowest unemployment rates are (in rank order) South Dakota, Utah, Wyoming, Florida, Arizona, Texas, Nebraska, Indiana, Colorado, and
North Dakota for the week of April 18, 2020. No densely populated East Coast state made the top ten list for the lowest unemployment, several western states with a lack of population density did make the low unemployment list and states with a more flexible approach for Work From Home, which employers were exempt from the business closure list and pushes to get employees back to work added several states to the lower unemployment list.
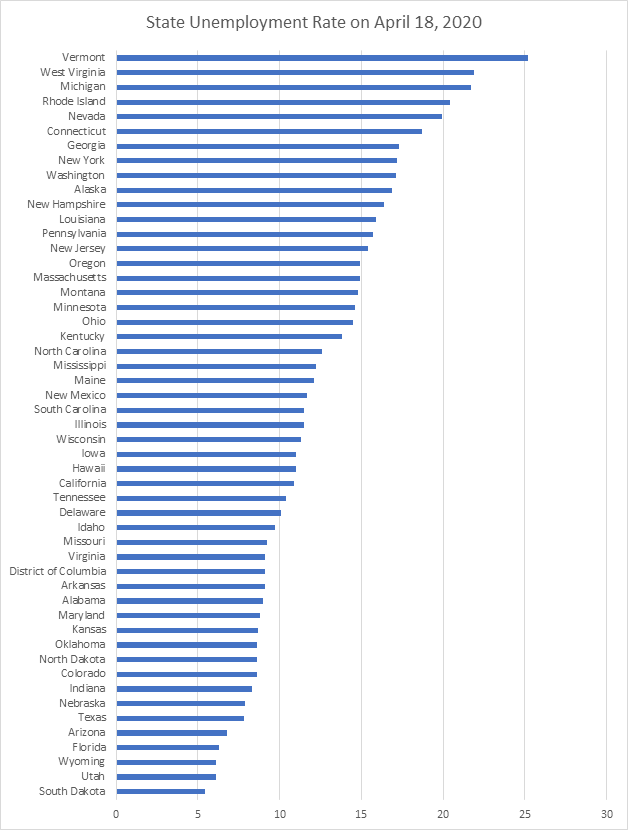
As the table above illustrates, the top 10 states having the highest current unemployment rate (in rank order) are Vermont, West Virginia, Michigan, Rhode Island, Nevada, Connecticut, Georgia, New York, Washington, Alaska, and New Hampshire. It is worthy of note that all these high unemployment rates are due to COVID 19—the nation was at an all time low in unemployment prior to the health crisis. Several East Coast states with high population density and infection rates are struggling economically more than other states. Other states are struggling more than their peers due to major impacts on large industry sectors like energy (Alaska) or hospitality (Nevada), early explosions of COVID 19 (Washington) and Governors who were more aggressive than others in forced business closures.
Again, measures of state performance against COVID 19 change every day. But early results illustrate the challenge of demographics for the East Coast of the U.S. and a range of economic and public policy decisions impacting the economic impact across the United States. The Montrose Group remains working and committed to supporting communities and companies during this challenging time by focusing on economic recovery.